
Google Analytics is a very powerful tool provided by Google that enables you to monitor your website’s traffic in a very accurate way.
You can monitor and study useful insights of your website’s traffic from the Pressidium Portal. But who are the visitors of your website? Every bit of information about them helps you serve their needs better.
With Google Analytics, you can better understand your audience: what is their language & location, their device & operating system, how they came across your site, what they like and what they do not find interesting on your website and many more.
All this information will give you valuable insight on your visitors and help you in customizing your content and increasing your traffic!
How do you set up Google Analytics?
It’s pretty simple to start with Google Analytics. Here’s how you can get your Google Analytics up and running:
Visit Google Analytics homepage at analytics.google.com. Log in using your Google Account credentials. If you do not have a Google Account you will need to create one. See here how.
Once you log in, you will be asked to make a series of choices in order to set up your account.
A: Choose what you want to track, a Website or a Mobile app.
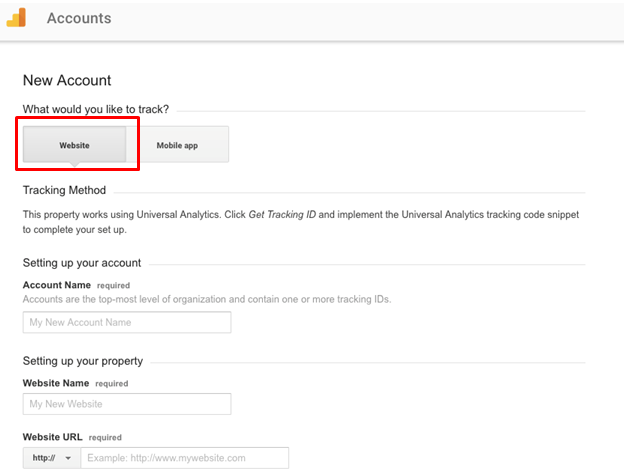
B. Give a name to your account. An account may include one or more website properties.
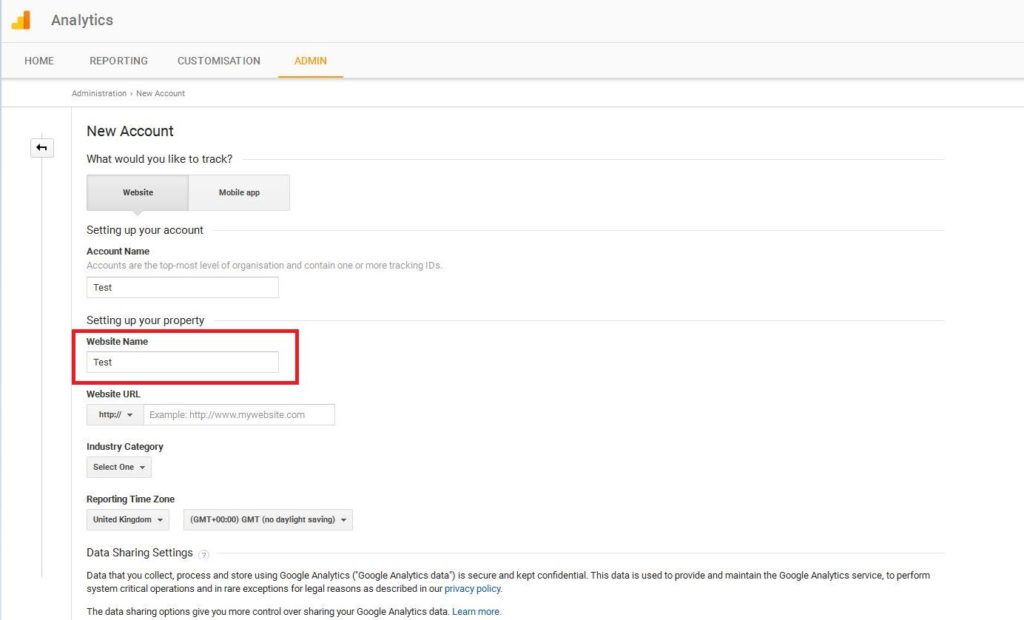
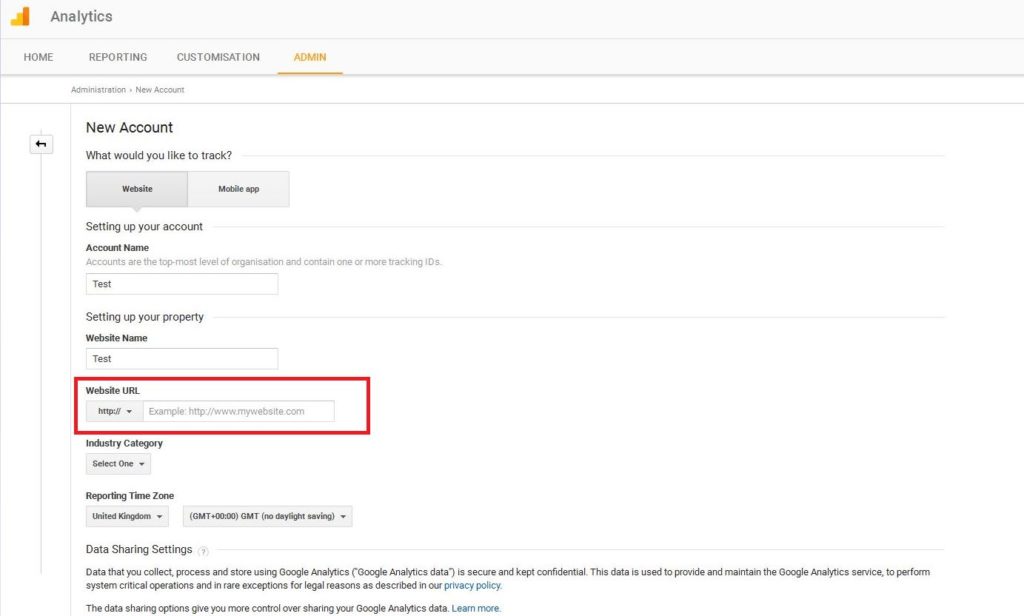
C. Set up your property by providing your website’s name & URL.
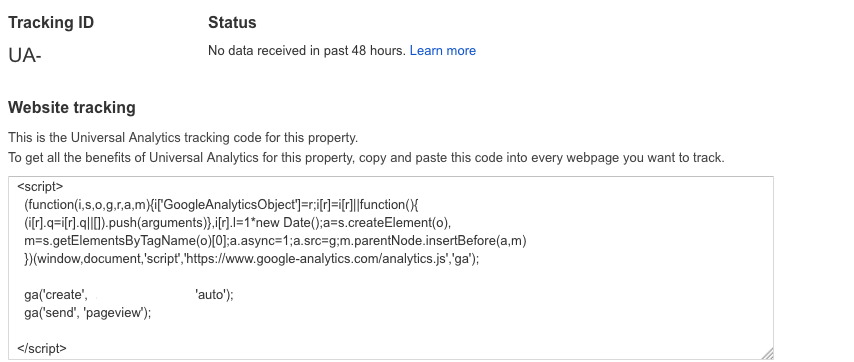
D. Insert the Google Analytics code to your website.
Once you fill the required information, Google Analytics will provide you with a website tracking code. Simply copy and paste this code into the webpage you want to track, and you’re done!
There are many WordPress plugins that you can use to do this, in an easy and error-free way. Here are some of our favorites:
What are Some of the Key Insights I Can Discover?
Now that your Google Analytics account is properly set up, you can start tracking your data. 24 hours after code insertion, data will start coming in. Here are some basic reports you can study.
Audience Overview
Knowing your audience is the first step in understanding what they are looking for and how you can better address them.
When you first log in, the Audience Overview report appears. You can also find it by clicking Overview on the left side menu.
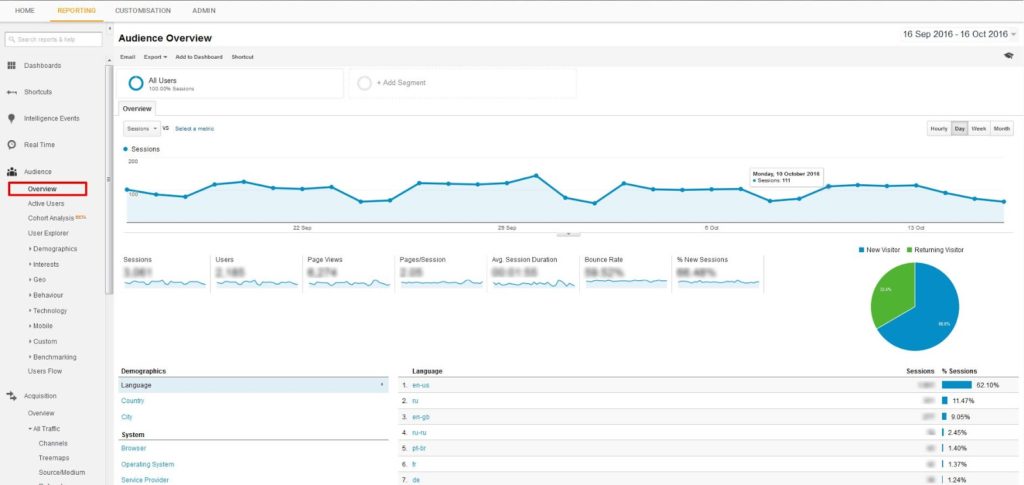
It is important to understand some of the metrics that are found in Google Analytics and what they mean :
- Sessions (previously known as Visits): The time period a user is actively engaged in your website.
- Users: Users that had at least one session on your website.
- Pageviews: The number of times your pages were viewed. Repeated views are counted multiple times
- Pages/Session: How many pages were viewed during a session. The higher the number the more the user interacts with your website.
- Avg Session Duration: The time a user spends on your website.
- Bounce Rate: The % of users that leave your webpage without interacting with the page. A high Bounce Rate, might indicate that your website content is not relevant to your audience.
Demographics
Who are your visitors exactly? This is the most essential question in all commercial activities. Basic demographics are always the starting point in understanding your audience. Are the ones you think really interested in your content? Find out through the Demographics report under Audience > Demographics > Overview.
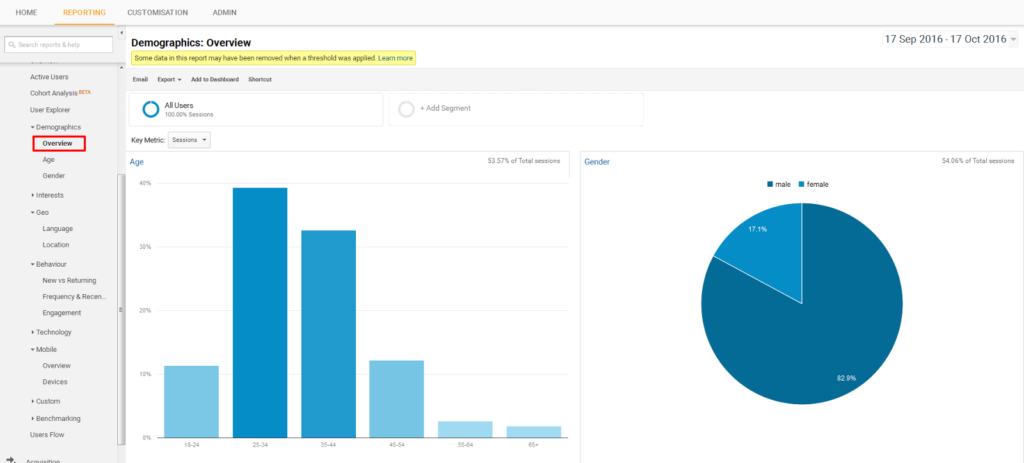
This report shows you the main audience characteristics, such as gender & age group. Use this information to customize your content in order to target successfully the gender & age groups that you are interested in. Alternatively, identify a potential audience that you are not addressing at the moment and capture their attention!
Geo Report
Ever wondered whether visitors from other countries visit your website? Google Analytics’ Geo Report, allows you to see where your visitors are coming from. You can find the Geo report under Audience > Geo > Location. This report provides you with a map showing your traffic geographical sources and a list of your visitor’s countries.
You can also drill down to city level by clicking on each country. Knowing this, you can discover visitors that are located in places you didn’t ever dare to imagine! You can use this information to create custom content for visitors in a specific area or intensify your promotions there.

Acquisition
How do your visitors find you on the world wide web? Have they discovered you from your social content or did they found out about you by searching? Those questions can be answered by the reports of the Acquisition section, which presents how were your visitors directed to your website.
Channels
Every website owner is putting a lot of time and effort to promote their website throughout different channels, some of them that require payment and some free. The Channels report will let you understand which channels contributed to your website’s traffic. Find it under Acquisition > All Traffic > Channels.
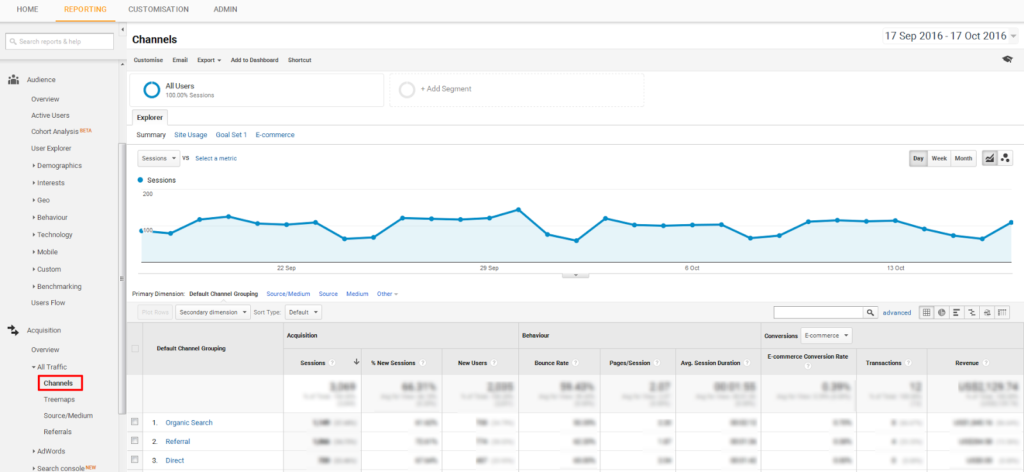
The Channel report helps you understand two things. First, where your visitors come from, and second how a specific channel contributes to your traffic.
Try our Award-Winning WordPress Hosting today!

For example, you might verify your hunch that social media is one important source of traffic to your site. However, you also need to pay attention to the bounce rate. A high bounce rate might indicate that the visitors coming from social media, are not very interested in your content. In this case, you might want to experiment in changing it, to see if you can turn it around.
Another interesting area to study in the Channels Report, is to the channel that brings the majority of new visitors to your website.
You can further drill down on the specific details of each channel, by clicking on each option.
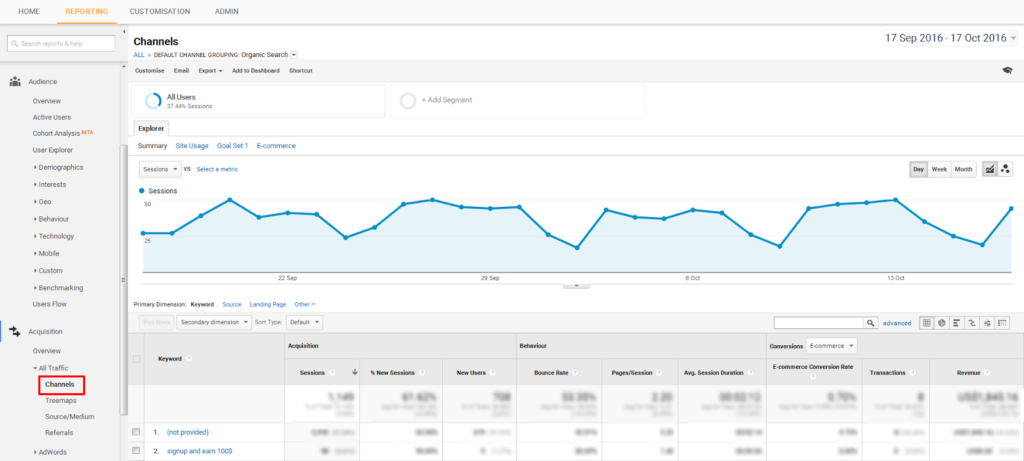
For example, on the Organic Search section, you can discover the keywords that people searched for and found your website. With this report you can evaluate your SEO keyword targeting, and find ideas about new keywords.
Source/ Medium
For a more detailed view regarding your traffic sources, visit the Source/Medium report, located under Acquisition > All Traffic > Source/Medium.
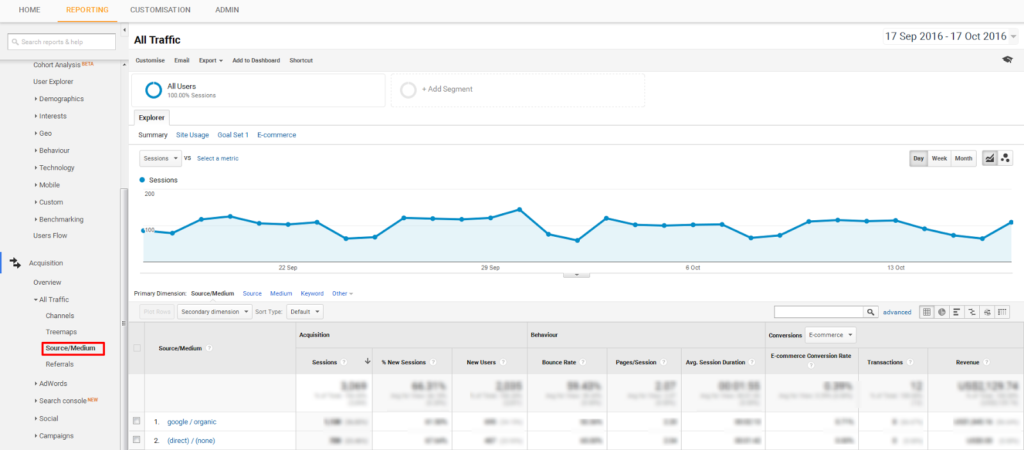
With this report you can monitor at the same time the Source and Medium of your traffic. This way you can see the amount of traffic arriving at your website from a specific social medium whether that be social/facebook.com or social/twitter.com etc. You can easily and accurately evaluate at a glimpse, the media that were most valuable to your website. Look out for media and sources that you might not have taken into consideration, but which appear to have an impact on your traffic. This is a good area to invest in!
Behaviour
In the Acquisition section, you discovered how the visitors ended up on your website. The Behavior section will allow you to monitor their behavior on your website.
Pages
What is the most visited page of your website? How useful is a page to your visitors? You can answer these questions with the Google Analytics Content report, that can be found under Behavior > Site Content > All Pages.
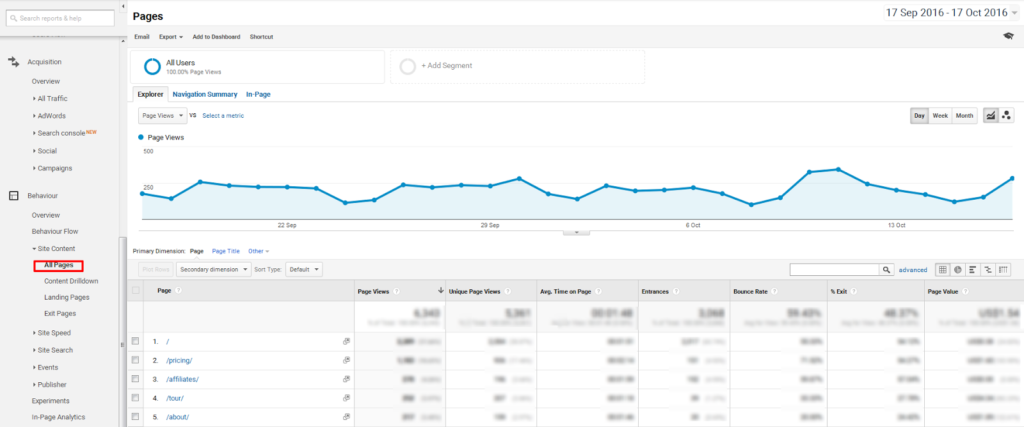
Find out the most popular page of your website or the most popular blog article. Understanding the top content of your website, will help you elaborate on topics that attract more traffic to your website.
Do not limit your studying to the Page Views or Unique Page Views metrics. Looking carefully at the Bounce Rate of your site , will give you precious information about possible problematic pages. For example pages that visitors bounce from more frequently. The higher the Page Views metric, the higher the interest of the visitors on the specific page.
You’re now ready for some analysis!
This was a short guide to quickly get started with Google Analytics and help you improve your business. Use the Google Analytics reports to discover more details about your audience. The more you know your audience, the better you can talk to them. The information provided here in basic Google Analytics reports that website owners should use on a daily basis. A series of more detailed articles that delve into specific reports and metrics will follow. So stay tuned!
Start Your 14 Day Free Trial
Try our award winning WordPress Hosting!


