A fast website is now an absolute must. In a mobile age and, with inpatient consumers, a slow website could be the difference between your business thriving or failing. So, how exactly do you test your website for speed and, how can you identify any issues that might be slowing it down?
In this article we’re going to look at a popular tool called WebPageTest. This measurement tool provides a raft of detailed statistics and data that can be used to pinpoint areas of your site that could be improved from a performance perspective. The sheer volume of information provided however can be a bit overwhelming. Not to worry… we’re going to break down how to use WebPageTest step-by-step so it becomes clear how to make the most of this free tool.
Getting Started with WebPageTest
First thing’s first, head to webpagetest.org to get started. The layout is super clear and you’ll immediately see a box where you can enter your website url.
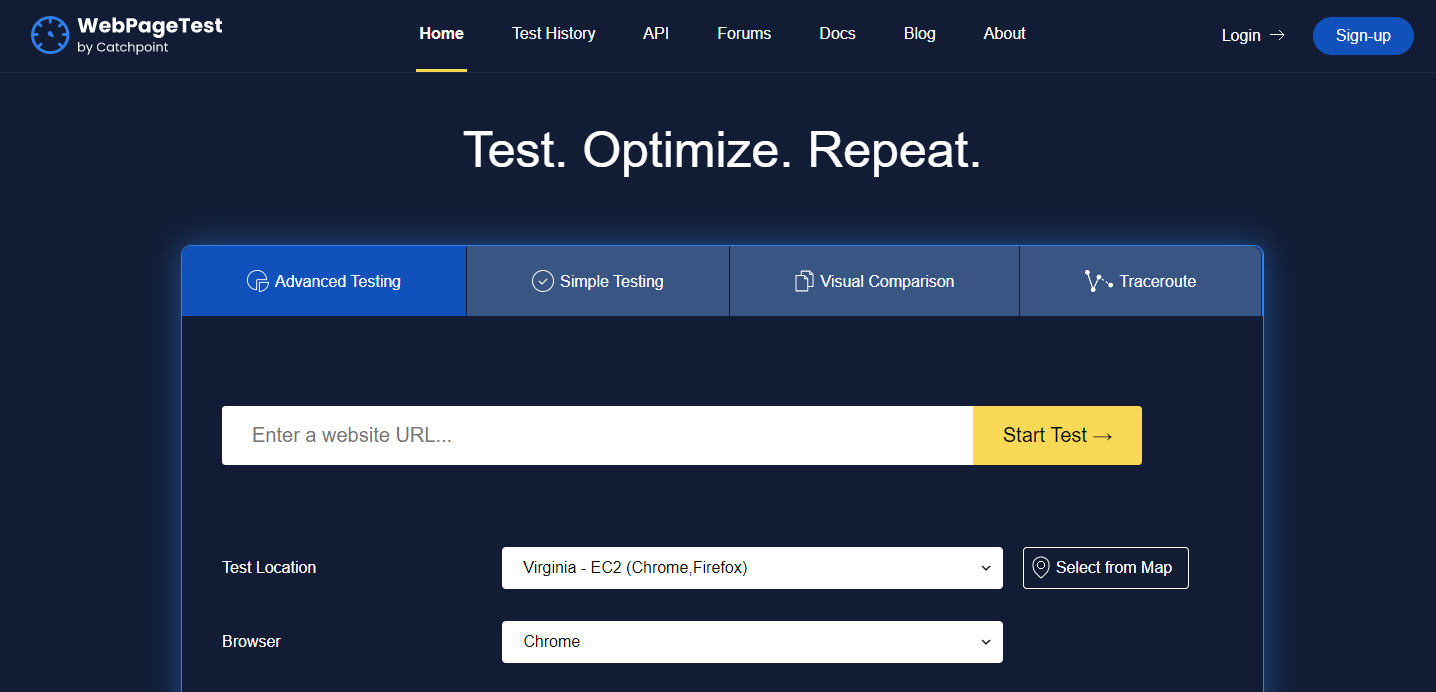
You have a choice to make at the outset… do you use the default ‘Advanced Testing’ tab or head to the ‘Simple Testing’ tab? Well, the Simple Testing feature is great for a quick overview of your site but for this article we’ll look at the Advanced Testing tab.
Advanced Testing Settings
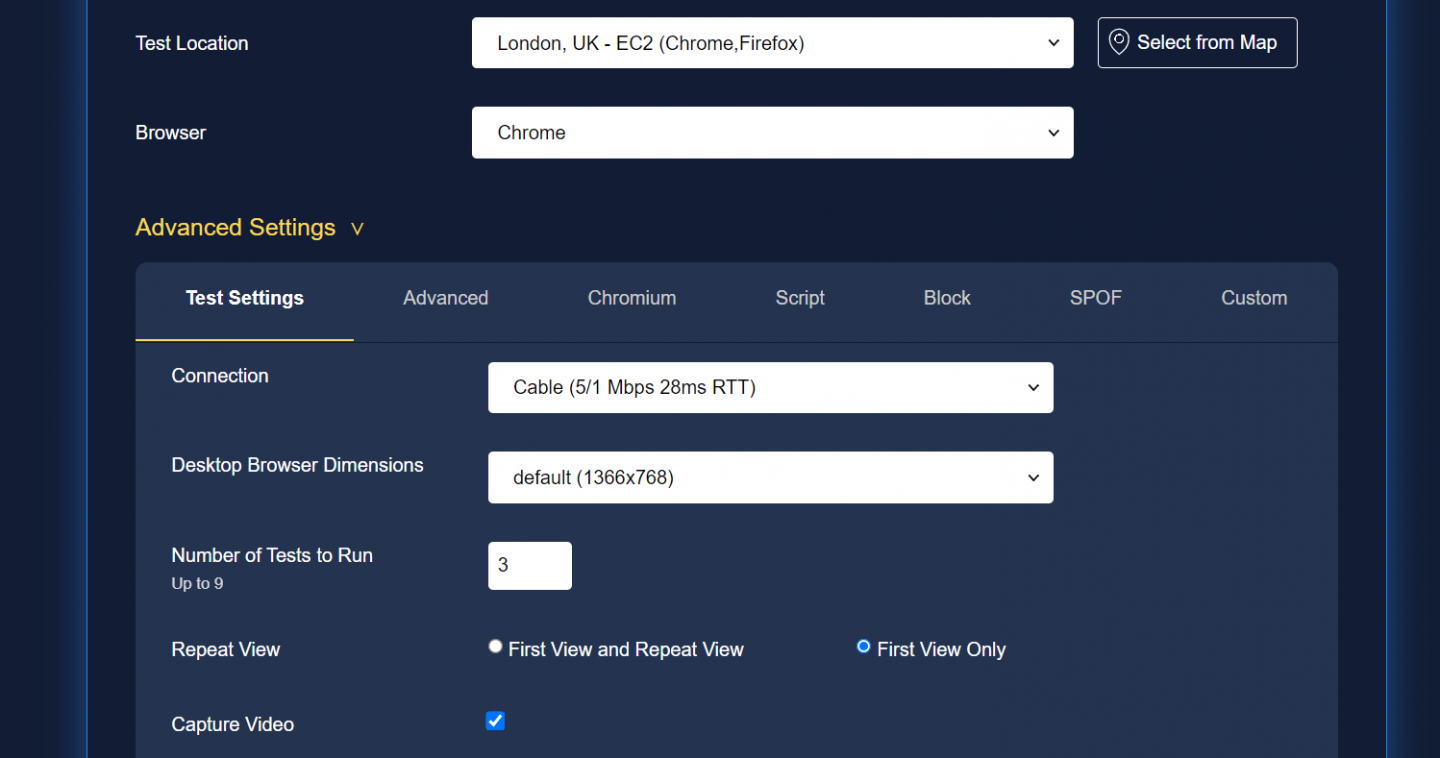
Scroll down the page and you’ll see a Test Location dropdown menu. This is pretty self explanatory. The location you want to choose is the one closest to where your target audience is located. If they’re based in Australia, then testing from London, UK doesn’t make much sense. The aim of this exercise is to find out how our website performs for our users.
There are a ton of locations but some locations offer more test options than others in the form of the browser used for the testing. Again, you want to try and select one that is likely to be used by your target audience. To view some stats on which browsers your website is visited from, you can use tools like Google Analytics.
Other really cool settings you can select are things like the connection. So, this would be how the end user’s device is connected to the internet. Click on the drop down menu alongside ‘Connection’ and you’ll see options that include a 3G connection (slow or fast). That’s really neat as it gives you a real world feel for how your audience will experience your site.
Another setting that’s pretty useful is the ‘Repeat View’ option. This option when enabled means the site will be re-tested after the first load which helps show the impact of any caching you have enabled on your site.
There are a raft of further advanced options which you might want to explore. For most of us, unless you’re taking a really deep dive into testing your site, the settings outlined above will be enough. For those who want to find out more about the real nitty gritty settings available check out the WebPageTest docs.
Make a note of any of the settings you have changed. It’s important that during the testing and then optimizing phase that you keep re-testing using the same settings otherwise you’ll skew the results you’re getting. Once you’re ready, hit the ‘Start Test’ button and then sit back and wait from the results (normally takes about a minute).
First Screen
In this example we’ve used Apple’s website (apple.com) and tested it over a fast 3G connection from London, UK. The initial results are shown below:
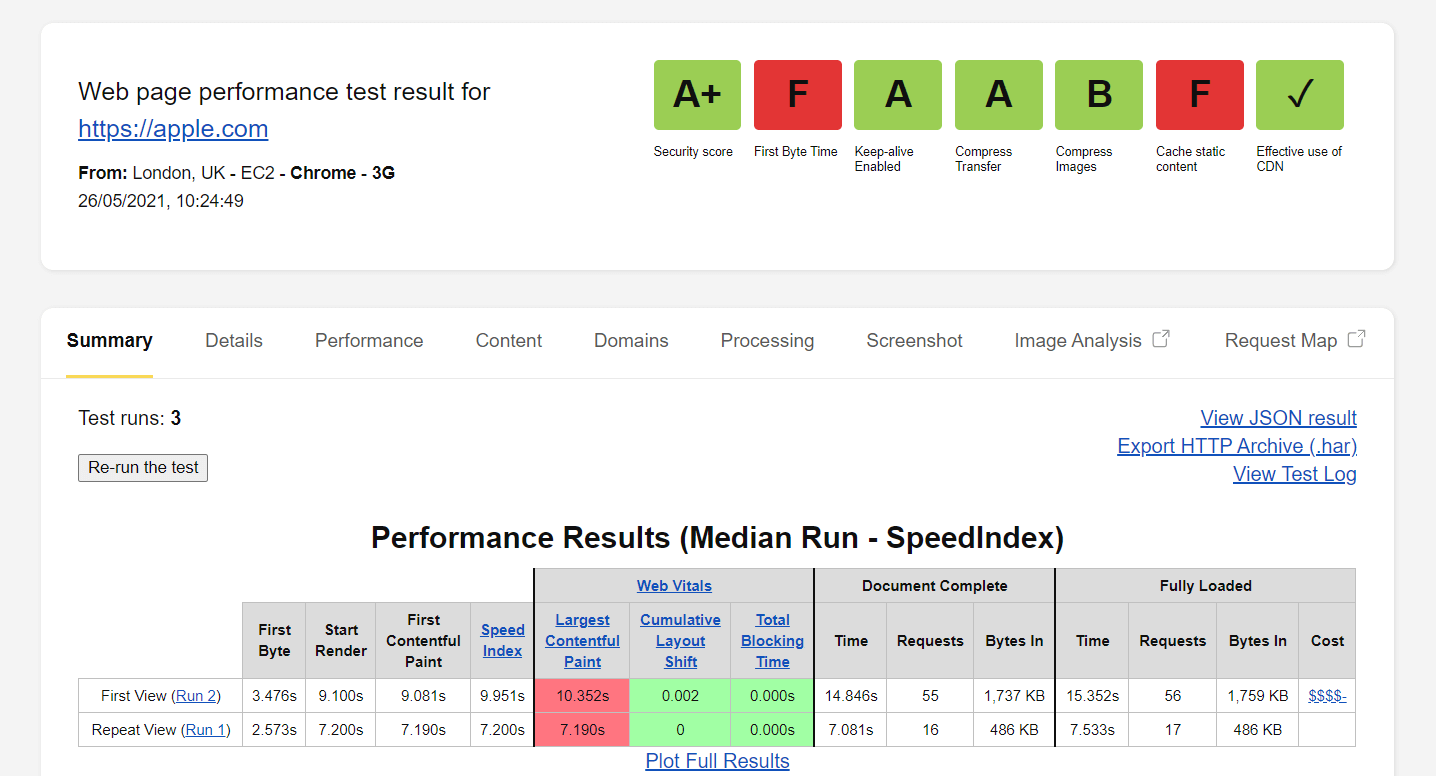
Take a look at the top right and you’ll see 7 colored boxes which provide an initial ‘heads up’ overview of how the page has performed. Let’s examine what each of these are.
Box 1 – Security Score
This is a recent feature provided by WebPageTest which is actually an integration with Snyk and provides an insight into the security of a website. If you click on the colored box you’ll be taken to the synk.io website which contains a detailed analysis of the website in question from a security perspective. Of particular note are the HTTP Security Headers that are exchanged between a client and a server to define the security details of the communication. The most important are Strict-Transport-Security, Content-Security-Policy, X-Frame-Options.
Try our Award-Winning WordPress Hosting today!

If any vital Security header are missing from your site you’ll be informed of this on the Synk website.
Box 2 – First Byte Time
The second box provides the First Byte Time (otherwise known as the Time to First Byte or TTFB). This is the time taken until the server responds with the first byte of data back to the client request. Ideally you’d aim for a figure below 300ms. This value is more server related and is irrelevant to the time consumed for your website files to be rendered. It can be affected by a slow DNS server for example or insufficient caching.
At this point it’s important to note that if you have cache enabled you should re-run your webpage test so that the cached content will be measured. In fact, it is recommended that you run the test at least 3 times to ensure that the results fully reflect the cached content on your site.
The First Byte Time is the sum of three values: The time needed for the HTTP request to be sent, the time to be processed by the server and the time the server needs to send the first byte back to the client. You can further details on this by clicking on the box:

As we can see, the Apple website didn’t do too well in this particular portion of the test.
Once this connection has been made, resources can start being delivered. The most common reasons for a slow TTFB are the networking issues, the web server configuration, possible server disk I/O, and RAM issues.
Box 3 – Keep Alive
The ‘Keep-alive Enabled’ box shows the state of the keep-alive HTTP header. When this header is enabled, data will be transferred using the same connection, otherwise a new connection must be created for every file needs to be transferred. Keep-alive is enabled by default in most cases and generally is a server-side setting. if you need to enable it yourself you can edit your .htaccess file and insert the code below
<ifModule mod_headers.c>
Header set Connection keep-alive
</ifModule>
Box 4 – Compress Transfer
The Compress Transfer value represents the status of the Gzip compression. This is a technique used to compress and later decompress your static files in real time. This way the transfer time is reduced because the file size is reduced. If your server provider does not apply this technology by default you can do it yourself by specifying the corresponding rule for each type of file like this:
 AddOutputFilterByType DEFLATE image/svg+xml
 AddOutputFilterByType DEFLATE image/x-icon
 AddOutputFilterByType DEFLATE text/css
 AddOutputFilterByType DEFLATE text/html
Again, clicking on the relevant colored box will take you to a detailed overview section so you can see what exactly is happening on your website.
Box 5 – Compress Images
The Compress Images box is fairly self explanatory. Click on it and it will show you what images could be better compressed.
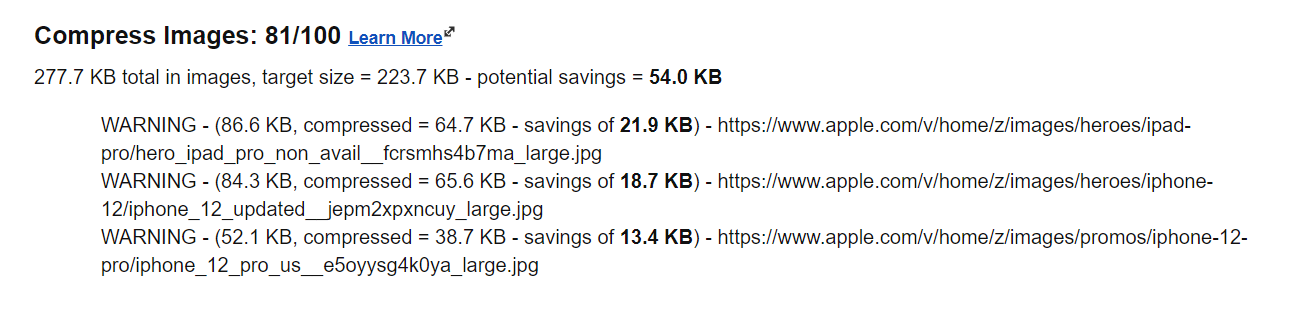
In this case, WebPageTest has identified three images that it thinks could be successfully compressed further saving 54kb in data that doesn’t have to be transferred. This might not sound much but on a mobile every kb you can save does make a difference.
Images are the most space consuming aspect of your static content. Compressing them is an absolute must. The WebPageTest analysis makes it easy to identify which images might be slowing your site down and therefore need attention.
Box 6 – Cache static content
If you hit the box ‘Cache static content’ you will be taken to a detailed section called ‘Leverage browser caching of static assets’.
Browser caching can be leveraged by your developer or administrator by instructing the web browser when to cache a resource, when not to, and for how long with the use of the correct HTTP headers. You can find some more detailed information on browser caching in our article ‘How does the browser cache work?‘. You can also find out how Pressidium implements browser caching here.
Box 7 – Effective use of CDN
A CDN (or Content Delivery Network) is well worth using if you have a user base that is spread out geographically. If, for example, all your customers are based in London and your host server is also located in London then there probably isn’t a lot of point in using a CDN. If however, your users are more geographically diverse then a CDN can make a huge difference in the performance of your site for those users by placing a copy of your website on a server located nearer to them.
If you are using a CDN then WebPageTest will look at how effectively this is working.
Performance Results
Let’s crack on and look at some more data beginning with the Performance Results which you’ll see at the top of the Summary Tab.
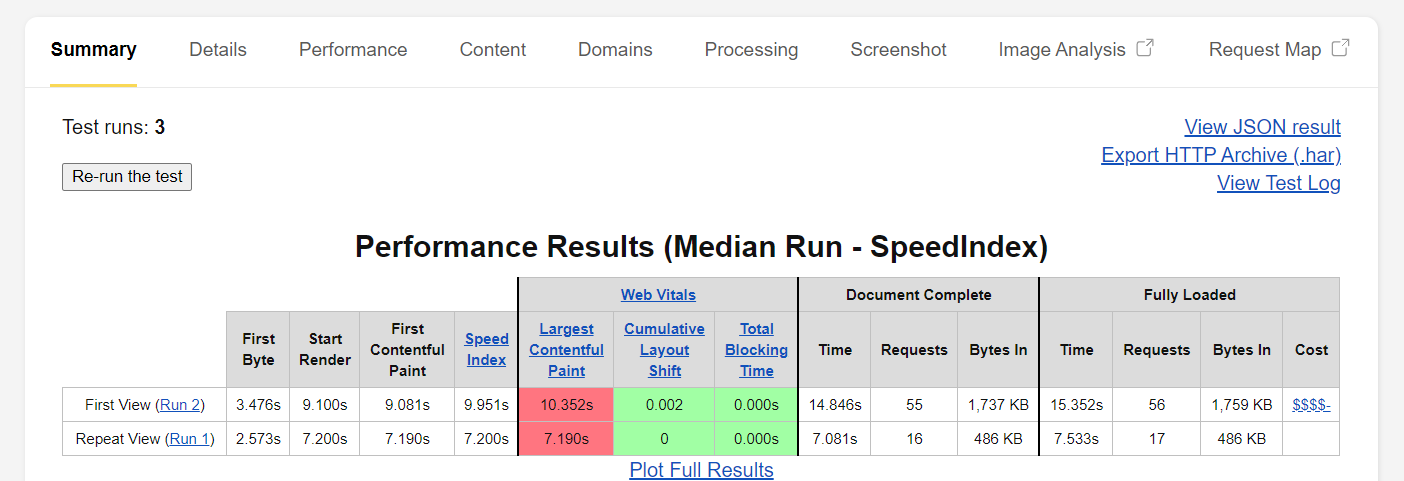
In the performance results we can see the most important overviews for things like First Byte Time, the Speed Index which is the average time at which visible parts of the page are displayed, Cumulative Layout Shift (CLS) for measuring visual stability, the time consumed until the Document loaded fully and more.
Waterfall View
Right below the Performance Results we can see the waterfall view for each of your runs. If you click on any of them you will be directed to the page which contains full details of the run in waterfall format.
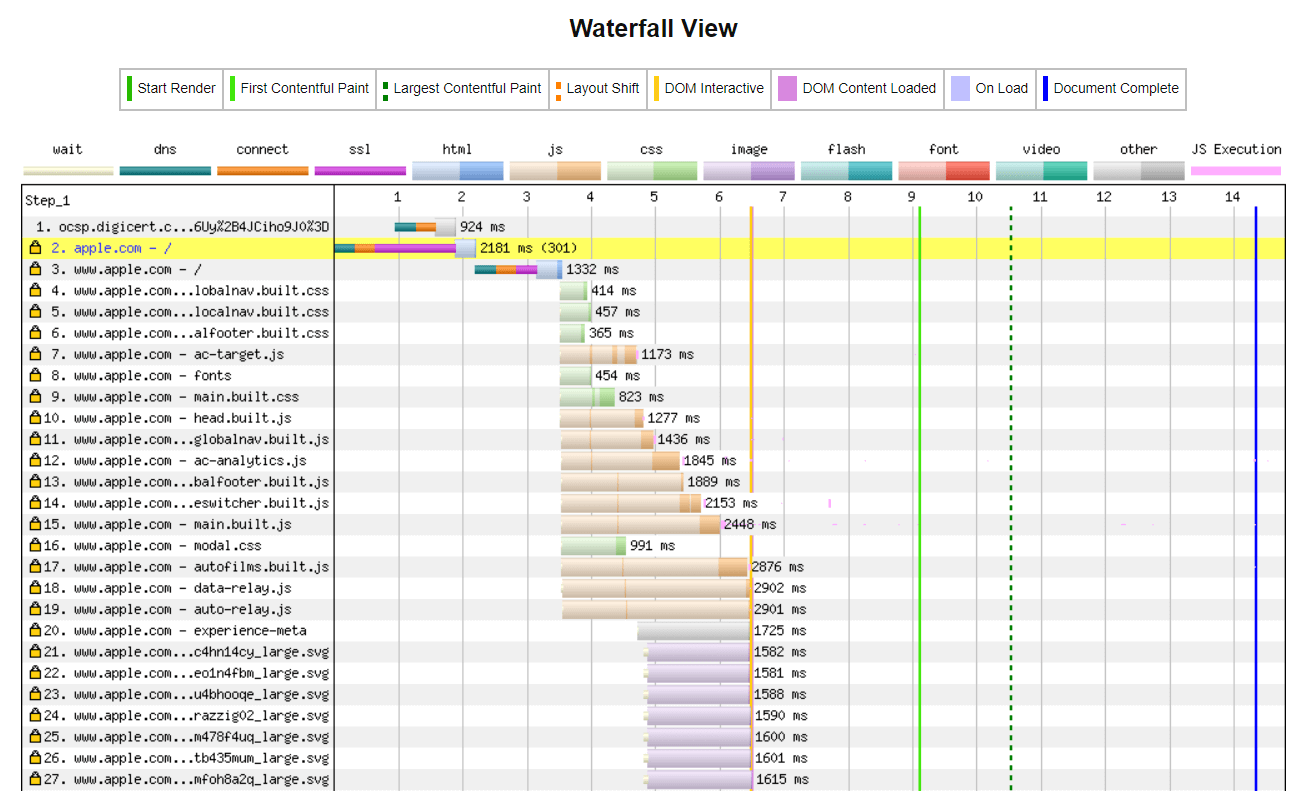
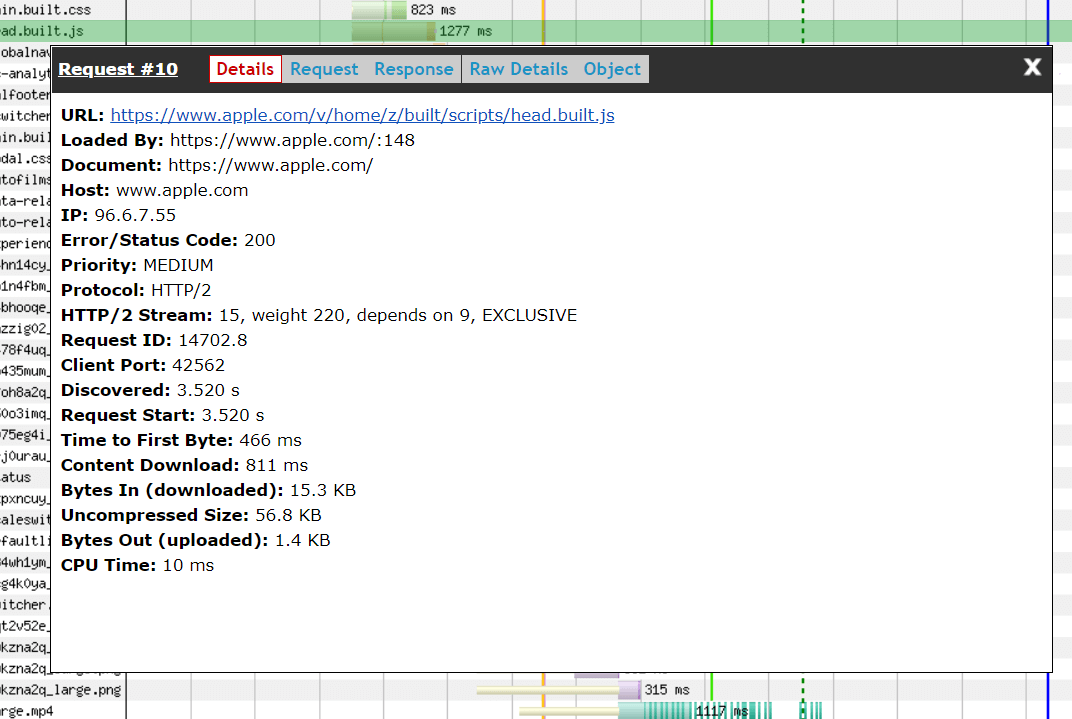
You will be provided all the performance statistics for each individual asset of your website. These are differently colored making it easier to distinguish between them. If you click on any of these a popup opens which provides even more details.
The Waterfall View is a visual representation of the page and how reach component loads. This allows us to easily identify any components that could be slowing things up. It’s seriously helpful to be able to see where the bottlenecks are and means we can fix issues with pinpoint accuracy rather than having to guess.
Connection View
The Connection View board is also a very useful feature as it allows you to identify web performance issues very easily by visually summarizing the measures for the connections between the browser and the server.
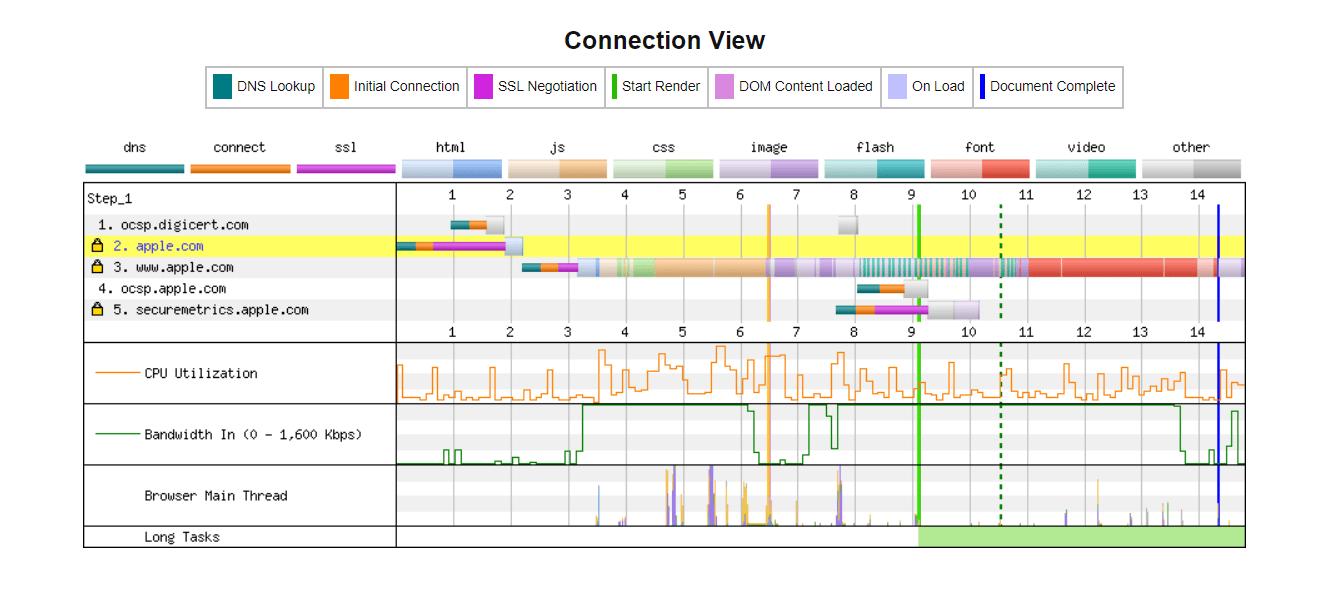
You can see the connection status right through from the DNS, Initial connection, SSL negotiation through to things like video resources. Below this, there is also a graph depicting the CPU usage on the device that is loading the website. There is also a bandwidth indicator showing the levels used during the data rendering.
Requests Details
Finally, below the Connection View, you are provided with two more analysis boards – Request Details and Request Headers.
The Request Details board is very helpful and lists every resources requested along with data relevant to that request such as the content type, the request start time, the number of bytes downloaded and much more. This table is actually sortable… just click on the column headers to order by that particular column.
The Request Headers board provides (yes, you guessed) the list of request resources along with the header information. Click on each one for full details.
Conclusion
If you need an in depth analysis of your website’s activity, WebPageTest is a fantastic tool to use. Even if you don’t deep dive into the information it provides, you can get a quick feel for whether or not your site is working well and whether there is a need to look more closely at how it is performing. And best of all, it’s free!
Start Your 14 Day Free Trial
Try our award winning WordPress Hosting!