We know that in today’s competitive online environment, website performance plays a crucial role in customer satisfaction and brand reputation. Properly using performance testing tools enables websites to meet performance standards and user expectations, ensuring smooth user experience, optimal functionality, and high-traffic handling. These tools help identify bottlenecks, optimize load times, and improve user interactions, enhancing the website’s overall performance.
With users’ high expectations for fast and reliable websites, having the right performance testing tools is necessary for any website seeking success online. There are countless tools available today and some offer features that others do not, making some tools more relevant to certain objectives than others.
In this article, we will study a few of the most popular tools used today to help provide a better understanding of what they do and how they work to help you improve website performance.
Chrome DevTools
Chrome DevTools is a suite of web development and debugging tools built directly into Google Chrome and other Chromium-based browsers.
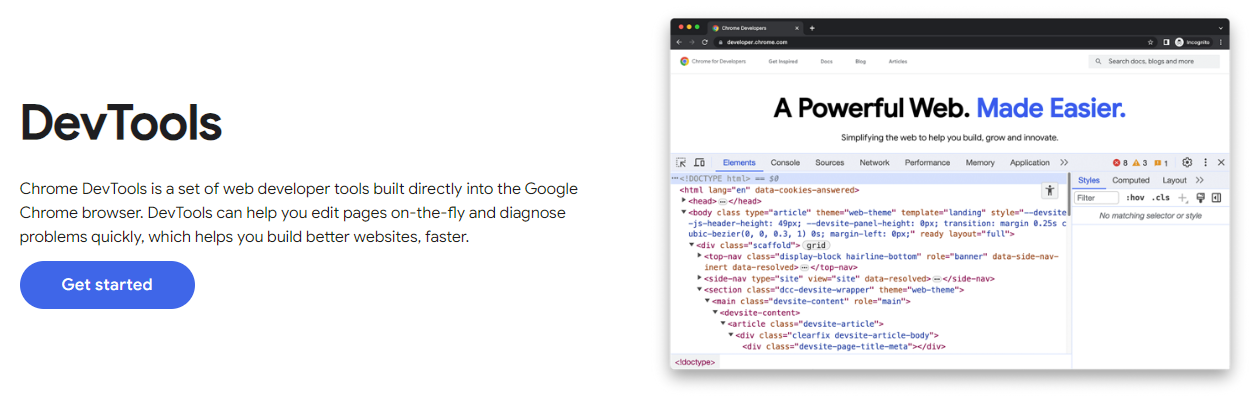
Admins and developers worldwide often use this useful toolkit as an initial point of reference for examining the inner workings of websites and web applications from an end-user perspective.
With a particular emphasis on performance, Chrome DevTools offers an extensive selection of features designed to analyze and optimize speed, creating a seamless and engaging user experience.
To access Chrome DevTools on Windows and Linux desktop installations, use the three-dot menu in the top-right corner of the browser. Below the More Tools menu item, select Developer Tools.
You can use the keyboard shortcuts Ctrl+Shift+I or simply press F12. The same keyboard shortcuts work for Mac by replacing the Ctrl key with the Cmd key.
The following services and tools are made available by Chrome DevTools:
Performance Panel
The Performance Panel provides a drill-down of a website’s activity, allowing you to analyze its runtime performance.
In current versions of Chrome, the Performance panel can also help you inspect Core Web Vitals while you interact with the page. This is useful for spotting slow interactions, layout shifts, and rendering delays that may not be obvious from a simple page-load test.
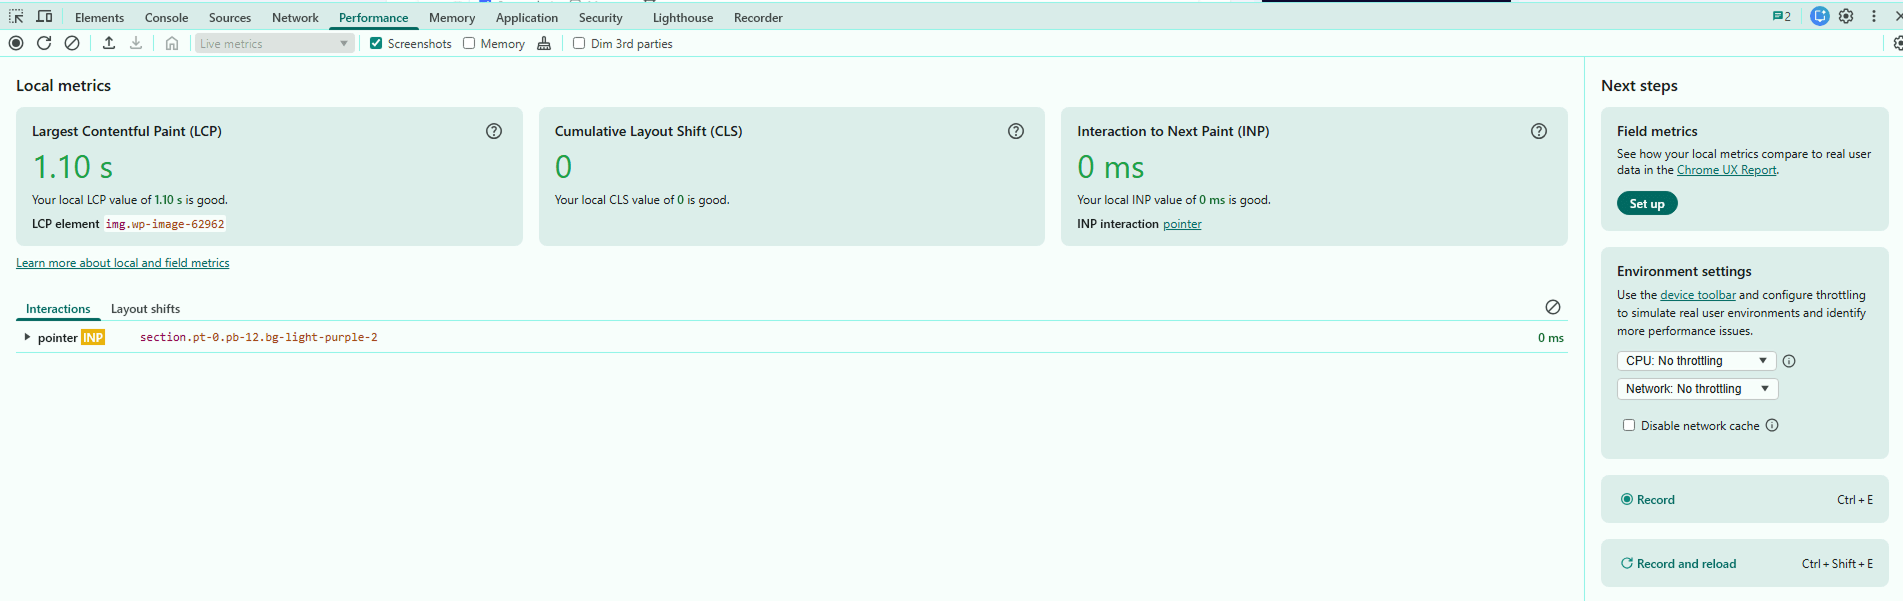
This includes JavaScript parsing and execution, layout rendering, style calculations, and resource loading, among other things. Key metrics including frame rate, CPU usage, and network requests, to list a few, are provided by the profiler.
Options including CPU and network throttling that are provided to simulate different devices and network conditions are also provided in the capture settings by clicking the gear or cog in the top-right corner.
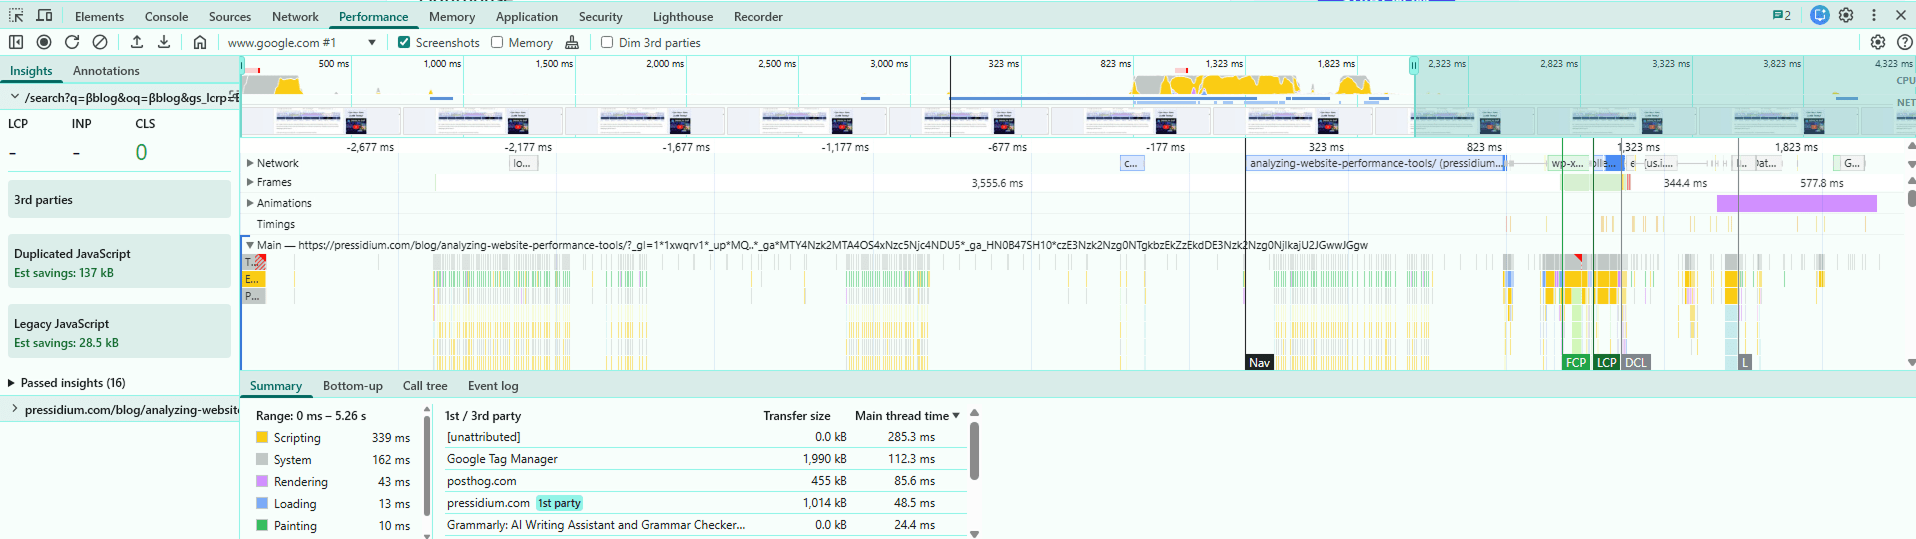
By inspecting the results, individual tasks, function calls, and rendering events in the timeline, you can precisely locate and optimize resource-intensive operations, thereby improving overall webpage performance.
Here are the general steps for using the Performance Profiler:
Start Recording
To start profiling the performance of your page, open the Performance panel and click the record button (the circle at the top-left of the panel). This will start recording any activity on the page. In this case, clicking the refresh button next to the record button allows you to profile the open webpage from before it loads to after it finishes loading, but you won’t be able to include parts of the webpage activated by user interaction.
Interaction
After you begin the recording, you can interact with the webpage as a user typically would after the page loads. The profiler will record all the activity.
When testing interactions, pay close attention to delays after clicks, taps, typing, or other user actions. These delays can affect Interaction to Next Paint (INP), the Core Web Vital that measures page responsiveness.
Stop Recording
When you finish recording, click the stop button next to the refresh button, and the profiler will provide a detailed view of the page’s activity during the recording.
Network Panel
Acting as a real-time traffic monitor, the Network Panel meticulously records every network request your page makes. It captures critical details including the load time, size, and status of each request. It enables developers to identify redundant or protracted requests and streamline network calls.
Coverage Tab
The Coverage Tab is a highly resourceful tool that aids in identifying surplus JavaScript and CSS code that the page is using while loading. By removing or deferring such code, it allows developers to reduce data transfer and expedite page load times.
Memory Profiling
DevTools also offers robust tools to monitor and debug memory issues that can often cause sluggishness or crashes. The Memory Panel and Heap Profiler provide in-depth insights into memory usage and allocation, making it easier to detect and fix memory leaks.
Lighthouse
Embedded in Chrome DevTools, Lighthouse is an automated auditing tool that attempts to evaluate the quality of webpages across several parameters, including performance. It’s like a comprehensive health check-up for your webpage, shedding light on areas of concern and suggesting potential improvements.
Lighthouse
Google Lighthouse, an open-source performance testing tool, has revolutionized website performance testing since its launch in 2017.
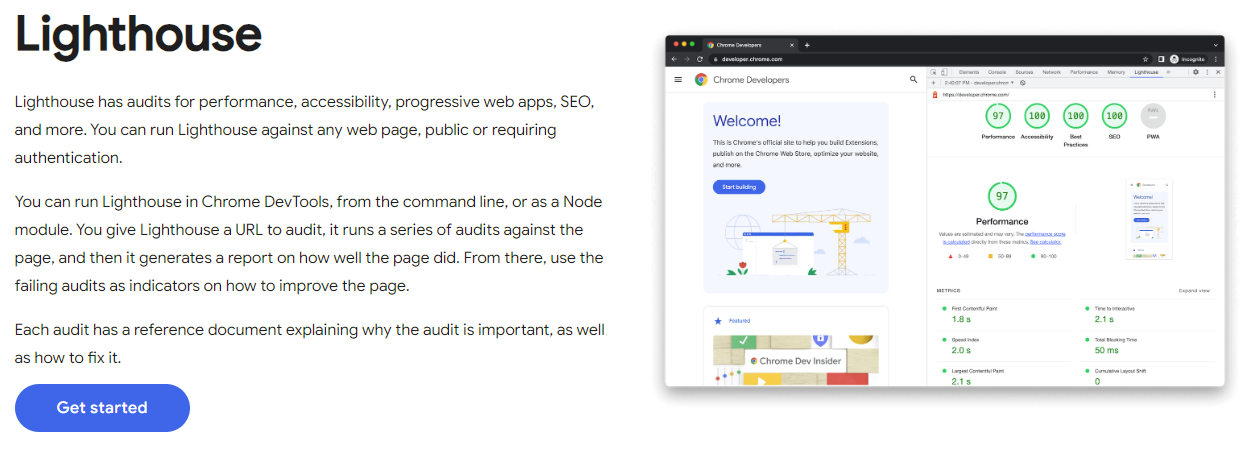
It provides a powerful and accessible tool for engineers and website owners to measure and optimize their websites for speed, accessibility, and user experience. Browser-based or front-end performance testing may be accomplished with Lighthouse.
Developed by Google, Lighthouse guides those who seek a comprehensive analysis of their websites’ performance, accessibility, and best practices. It leverages automation to generate detailed reports that simulate real-world user experiences across various devices and network conditions, making it an essential tool for optimizing web performance in a competitive digital landscape.
More information regarding Lighthouse scoring and its integration with Google’s PageSpeed Insights is addressed in a later section.
Google Lighthouse evaluates a website’s performance using several key Metrics.
Lighthouse can execute tests on both desktop and mobile, calculate the performance score based on metrics, and set specific pass, warning, and fail thresholds for each metric. To learn more about calculating the performance score for mobile and desktop, visit the Lighthouse Scoring Calculator page.
Lighthouse website performance metrics
Lighthouse performance scoring is based on lab metrics such as First Contentful Paint, Speed Index, Largest Contentful Paint, Total Blocking Time, and Cumulative Layout Shift. The exact weightings may change between Lighthouse versions, so treat the score as a diagnostic benchmark rather than a fixed measurement of real-user experience.
Here’s a brief explanation of the main Lighthouse performance metrics and their respective thresholds:
First Contentful Paint (FCP)
FCP measures the time it takes for the first piece of content to be rendered on the screen, such as text or an image. It is an important metric for assessing the perceived loading speed of a website.
Speed Index (SI)
SI evaluates how quickly the visible content of a webpage is displayed. A lower Speed Index indicates that the user will see the content faster.
Largest Contentful Paint (LCP)
LCP measures the time it takes for the largest visible element on the page to be fully loaded. It is a crucial metric for understanding user experience, as larger elements usually contain the most important content.
Total Blocking Time (TBT)
It measures user interaction delay after First Contentful Paint (FCP). It quantifies the time the webpage’s main thread is blocked. This delay prevents prompt response to user inputs.
Cumulative Layout Shift (CLS)
CLS quantifies the amount of unexpected layout shifts on a webpage, indicating visual stability. A lower CLS score means fewer layout shifts, improving the user experience.
Lighthouse Performance Metrics Thresholds (Mobile):
| Metric | Good | Needs Improvement | Bad |
|---|---|---|---|
| FCP | 0 ms – 1800 ms | 1800 ms – 3000 ms | >3000 ms |
| SI | 0 ms – 3400 ms | 3400 ms – 5800 ms | >5800 ms |
| LCP | 0 ms – 2500 ms | 2500 ms – 4000 ms | >4000 ms |
| TBT | 0 ms – 200 ms | 200 ms – 600 ms | >600 ms |
| CLS | 0 – 0.10 | 0.1 – 0.25 | >0.25 |
Lighthouse Performance Metrics Thresholds (Desktop):
| Metric | Good | Needs Improvement | Bad |
|---|---|---|---|
| FCP | 0 ms – 940 ms | 940 ms – 1600 ms | >1600 ms |
| SI | 0 ms – 1300 ms | 1300 ms – 2300 ms | >2300 ms |
| LCP | 0 ms – 1200 ms | 1200 ms – 2400 ms | >2400 ms |
| TBT | 0 ms – 150 ms | 150 ms – 350 ms | >350 ms |
| CLS | 0 – 0.10 | 0.10 – 0.25 | >0.25 |
Lighthouse results can vary between test runs because device performance, network conditions, browser state, server response time, and third-party scripts can change. Run multiple tests and compare trends instead of relying on one isolated score.
The most helpful information provided by far is the Opportunities. It provides us with specific recommendations and suggestions for improving website performance based on the test results. In the opportunities section, every recommendation comes with a detailed explanation. It outlines the issue’s impact on website performance and user experience. Also, it gives general guidance as to what may be done to resolve the issue.
Lighthouse is available for use for free from the Google Chrome browser’s Dev Tools under the Lighthouse tab. You may also use the CLI tool made available on the Google Chrome GitHub repository.
You may have already used Lighthouse without realizing it. PageSpeed Insights uses Lighthouse for lab-based diagnostics, and several other performance testing tools also include Lighthouse-based reporting or Lighthouse-style recommendations.
PageSpeed Insights
As far as performance testing tools go, one powerful and widely-used solution stands out: Google’s PageSpeed Insights. This tool helps engineers and site owners assess the performance of their websites by analyzing critical factors that contribute to user experience and search engine rankings. Powered by Google Lighthouse, PageSpeed Insights evaluates a website’s performance on both mobile and desktop devices.
PageSpeed Insights reports key performance metrics such as First Contentful Paint (FCP), Speed Index (SI), Largest Contentful Paint (LCP), Total Blocking Time (TBT), Cumulative Layout Shift (CLS), and Interaction to Next Paint (INP), depending on whether you are reviewing lab data or field data.
The three Core Web Vitals are currently
- Largest Contentful Paint (LCP)
- Interaction to Next Paint (INP), and
- Cumulative Layout Shift (CLS).
These metrics are updated by Google periodically, so it is worth checking Google’s current Web Vitals documentation when auditing performance.
LCP measures loading performance, INP measures responsiveness, and CLS measures visual stability. By examining these metrics, developers can gain a clearer understanding of a website’s strengths and weaknesses, paving the way for targeted optimizations.
PageSpeed Insights combines two types of data: lab data and field data.
Lab data comes from Lighthouse and is useful for debugging performance issues in a controlled test environment. Field data comes from the Chrome User Experience Report (CrUX), when enough real-user data is available for the tested URL or origin.
Field data shows how real Chrome users experienced the page over the previous 28 days, while lab data shows how the page performed during a single simulated test. For this reason, use lab data to diagnose issues and field data to understand real-user experience.
By utilizing this tool, businesses can ensure their websites are fast, responsive, and primed for success in the ever-evolving digital landscape.
💡 Free performance PDFs: Complement this section with our downloadable resources, How to Test & Measure WordPress Speed and Client-Side Optimization Quick Wins. These concise checklists cover benchmarking, testing workflows, and practical front-end optimizations to enhance your site’s speed and user experience.
WebPageTest.org
WebPageTest.org offers an in-depth analysis tool for web performance. It is notable for its ability to simulate user experience from different locations and devices.
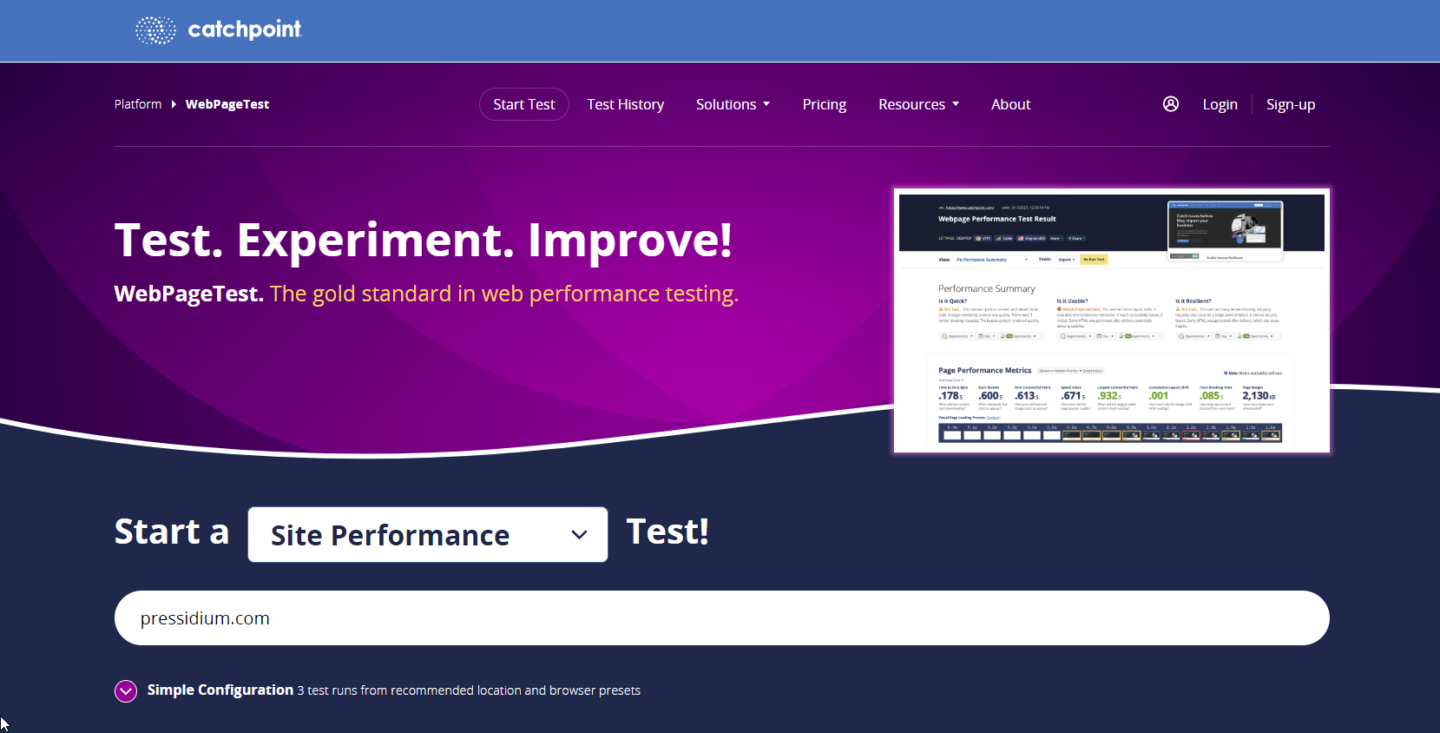
This tool allows users to test a webpage across various device and browser types and ranging network conditions providing detailed insights into a site’s performance. What sets WebPageTest apart is its comprehensive reporting, including waterfall views of resource load times, which can pinpoint performance bottlenecks.
However, users of the free version of WebPageTest may encounter limitations, such as the necessity to wait in a queue before their tests are run. This is due to the high demand for the service and limited resources available for free testing. While anyone can use WebPageTest for basic testing, creating an account unlocks additional features, like the ability to save test results for future comparison. WebPageTest also offers paid plans, which provide priority access to testing queues, and more testing options. We provide a detailed Performance Analysis with WebPageTest where we break down how you can use it.
GTmetrix
GTmetrix is a user-friendly tool that leverages Lighthouse for comprehensive website performance analysis, focusing on ease of use and clarity in its reporting.
It offers a snapshot of performance metrics, including Core Web Vitals, and provides actionable recommendations for improvements. GTmetrix is designed to track a website’s performance over time, allowing for the monitoring of speed enhancements or identifying when a performance decline occurs.
GTmetrix offers free access with some limitations, such as a cap on the number of tests that can be run daily and the potential for queue times during periods of high demand. Creating an account with GTmetrix is required to run tests. This enables users, however, to save their reports and access historical performance data. GTmetrix provides paid plans that offer additional features, such as more frequent testing, and advanced testing options. It also allows you to test from more locations around the world. These paid plans are designed to support more extensive testing needs without the wait times associated with the free service.
We will go into greater detail about PageSpeed Insights, Web Vitals, and Core Web Vitals in a future post. But let’s recap on what we discussed so far.
Get Your Free Performance Audit Today!
Discover hidden opportunities.

Found performance issues? Fix the delivery layer next
Performance testing tools can show you where a page is slow, but they do not fix the underlying delivery path.
If your tests show slow server response times, inconsistent global performance, heavy origin load, or caching issues, the next step is to improve how your WordPress site is delivered to visitors.
Pressidium EDGE sits in front of your existing WordPress hosting and serves eligible content from global edge locations. It can reduce origin load, improve response times for visitors in different regions, and protect traffic before it reaches your server.
Learn about Pressidium EDGE
Pressidium EDGE helps improve delivery by caching eligible WordPress content at the edge, reducing origin load, and improving response times for visitors worldwide.
Takeaways on website performance tools
PageSpeed Insights is a free and powerful tool. It leverages Lighthouse to analyze a website’s performance on both mobile and desktop devices, providing key metrics and actionable recommendations to enhance user experience and optimize site speed.
Both WebPageTest.org and GTmetrix offer invaluable resources for website performance optimization, with options tailored to different user needs.
As with PageSpeed Insights, these tools can provide Lighthouse-based reporting or similar performance recommendations while offering additional features such as selecting the test location.
The free versions are suitable for basic analysis and occasional testing, the paid subscriptions cater to more professional users. It requires more detailed data, frequent tests, and immediate access without waiting in queues. While we focused on a few popular tools, numerous other free and paid services exist, offering a variety of features.
This article is part of our comprehensive performance series focused on speeding up WordPress using real-world tools and techniques.
See Also
- What is Performance Testing?
- Measuring Performance: What to Consider Before Testing and Optimization
- Measuring Website Performance: PageSpeed Insights Analysis
- How To Reduce Initial Server Response Time (TTFB) in WordPress
- HTTP Compression
Want to master every phase of WordPress optimization? Read the complete WordPress Performance Optimization Guide online to go deeper into testing tools, server tuning, and advanced speed strategies.
No downloads. No email required. Just free, in-depth content.
Website performance is paramount for customer satisfaction and brand credibility. Therefore, it is essential to consult performance testing tools to ensure smooth user experiences and optimal functionality.
Hopefully, by reading this article, you are now more capable of leveraging these tools to your business benefit.
Start Your 14 Day Free Trial
Try our award winning WordPress Hosting!


Frequently asked questions about website performance testing tools
There is no single best tool for every situation. Google PageSpeed Insights is useful for checking Core Web Vitals and real-user performance data. Lighthouse is useful for lab-based audits inside Chrome. WebPageTest is better for detailed waterfall analysis, location testing, and advanced diagnostics. GTmetrix is useful when you want a clear report that is easy to monitor over time.
Lighthouse is the audit engine that runs controlled lab tests. PageSpeed Insights uses Lighthouse for lab data, but it can also show real-user data from the Chrome User Experience Report when enough field data is available. In simple terms, Lighthouse shows how a page performs in a test environment, while PageSpeed Insights can also show how real users experience the page.
No. The PageSpeed Insights performance score is a Lighthouse lab score. Core Web Vitals are specific user experience metrics, including Largest Contentful Paint, Interaction to Next Paint, and Cumulative Layout Shift. A page can have a good Lighthouse score but still need improvement in real-user Core Web Vitals, especially if users visit from slower devices, weaker networks, or different locations.
For WordPress sites, start with PageSpeed Insights to check Core Web Vitals, then use WebPageTest or GTmetrix for deeper testing. Chrome DevTools is useful when you need to debug specific front-end problems, such as slow JavaScript, render-blocking CSS, large images, or unused code. For best results, test both the homepage and important templates such as product pages, blog posts, landing pages, and checkout pages.
Test website performance before and after major changes, such as plugin updates, theme changes, new tracking scripts, design changes, or hosting/CDN changes. For business-critical WordPress sites, run performance tests regularly so you can catch regressions before they affect users, SEO, or conversions.
Different tools use different test locations, devices, network speeds, browsers, throttling methods, and scoring models. A test from one region on a fast desktop connection can produce very different results from a mobile test on a slower network. This is why you should compare trends over time instead of relying on one isolated score.
A good score depends on the tool, but for Core Web Vitals you should aim for fast loading, stable layout, and responsive interactions. As a practical benchmark, your Largest Contentful Paint should be 2.5 seconds or faster, Cumulative Layout Shift should be 0.1 or lower, and Interaction to Next Paint should be 200 milliseconds or faster.
For most websites, Largest Contentful Paint is one of the most important loading metrics because it measures when the main visible content appears. However, performance should not be judged by one metric alone. Interaction to Next Paint, Cumulative Layout Shift, Time to First Byte, total page weight, and JavaScript execution time can all affect user experience.
No. Performance testing tools identify issues and recommend improvements, but they do not usually fix the site automatically. You still need to optimize images, reduce unnecessary scripts, improve caching, configure your CDN or edge delivery layer, review plugins, and improve server response times where needed.
Visitors do not all connect from the same country, network, or device. Testing from multiple locations helps you understand whether your site is fast only near your origin server or consistently fast for a wider audience. This is especially important for WordPress sites with international visitors, ecommerce customers, or campaign traffic from multiple regions.