Whenever a WordPress website loads there are numerous things going on behind the scenes as information is pulled from a database and the page is built and then loaded. Because these queries retrieve information from the database and can involve every theme, plugin and core file it’s incredibly useful if they can in some way be monitored. Say hello to the Query Monitor plugin.
The Query Monitor plugin is one of the most popular tools for (you guessed it) monitoring WordPress queries. With a dedicated team providing great support and regular updates, the Query Monitor plugin provides invaluable help to web developers when website debugging.
Let’s take a closer look at the Query Monitor plugin and see how it can be used.
Introducing the Query Monitor Plugin
Query Monitor is a free WordPress debugging tool. As with all WordPress plugins, you can install Query Monitor from the plugin admin area.
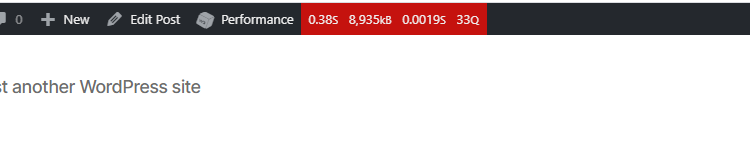
Once the plugin is installed and activated, a group of numbers will appear on every page you visit (in both frontend and backend views) that detail the load stats of the current page. These 4 numbers show the page generation time, PHP memory usage, database query time, and number of queries made.
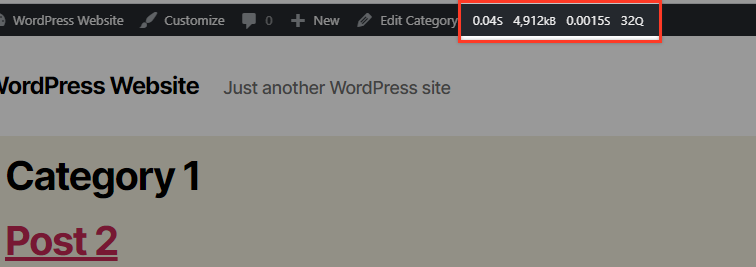
If you hover these numbers a dropdown menu will appear that provides links to additional data.
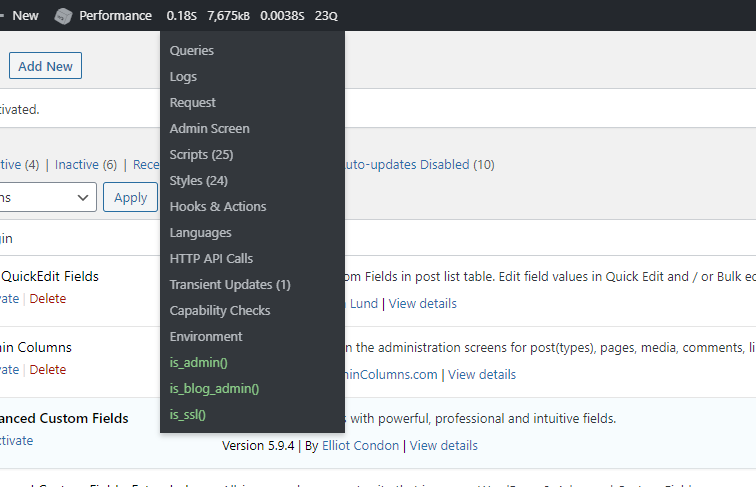
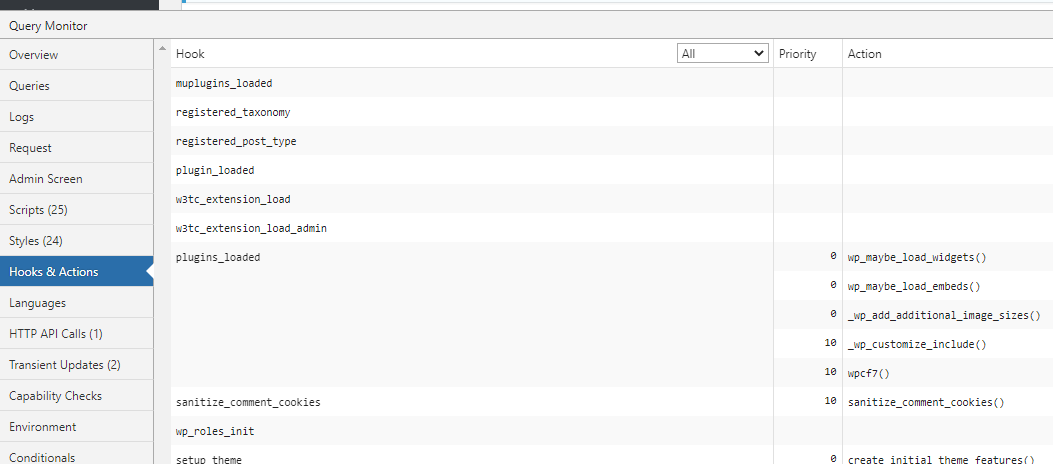
When you click any of these links a window appears at the bottom of the page with a sidebar menu that is identical to the menu depicted above that you can use to filter the results. The screenshot below shows you some of the results for the ‘Hooks & Actions’ option:
The last tab on the menu is called ‘Conditionals’ and is not the same for every page. For example, in the backend it shows like this:
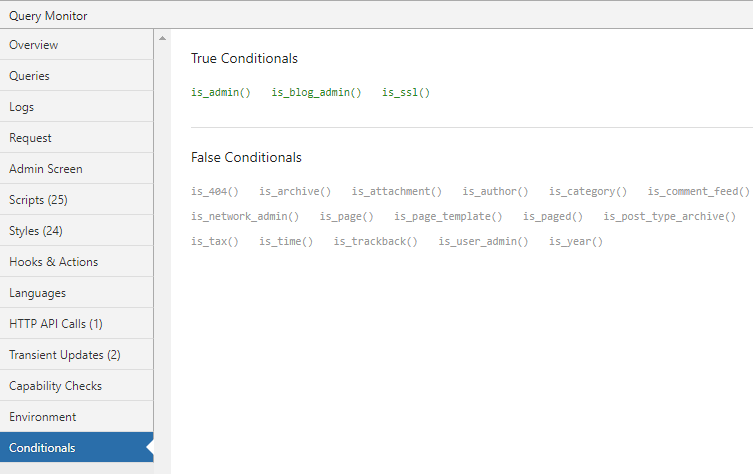
But if you view the same menu on the front end of your website you’ll see some different information as alternate conditions are used:
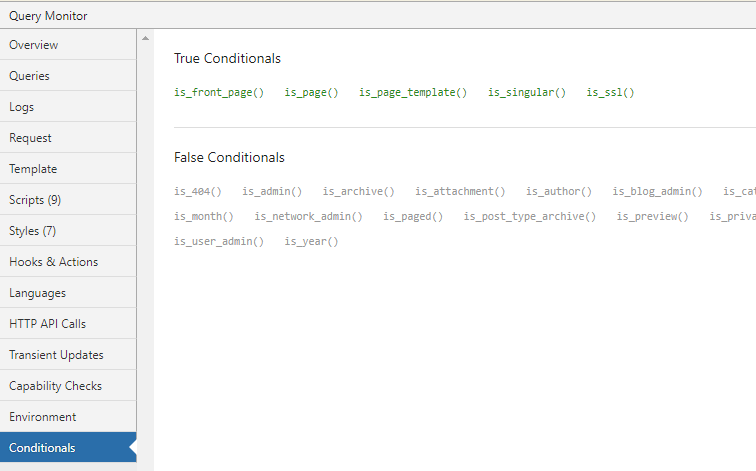
This tab can be a great tool to when you want to identify the right hook or conditional tag to use when adding new plugin or theme functionality.
What the Query Monitor Plugin Does
When you visit any WordPress page (either from within the Admin area or front end), the plugin gathers all WordPress processes that take place both on the server as well as between the server and visitor’s browser. In order to show them to you it creates an easy to read report that can be viewed as shown above.
Try our Award-Winning WordPress Hosting today!


Since it works on every page of your website (both from within the Admin and front end), you can use it to debug any front end or back end processes. This might range from identifying and debugging slow database queries, AJAX calls, REST API requests, and much more. The information provided is massively useful when it comes to trying to pinpoint a specific problem and can significantly speed up troubleshooting.
Some Query Monitor Examples
There are a huge number of instances where using Query Monitor can help. For example monitoring script dependencies, WordPress hooks, hosting environment details and conditional query tags can assist in solving a lot of problems. We’ll take a quick look at some common uses below.
Syntax error troubleshooting
For the purpose of this example we used a custom SQL query in a single post’s template.
//// SLOW QUERY TEST
global $wpdb;
$prefix = $wpdb->prefix;
$slowq = "SELECT * FROM {$prefix}_options WHERE option_name LIKE '%siteurl%'";
$results = $wpdb->get_results( $slowq );
echo $results[0]->option_value;
When we refresh the page we can see that we have no results for the PHP print output. In addition the Query Monitor tab has turned red.
If you hover over the warning another more detailed warning will display which reads ‘Database Errors (1)’. Click this and you can see the error in detail helping you understand the syntax error.

Now if you fix the error and reload page, the warning should disappear.
As you can see we quickly found the cause of our problem using the Query Monitor plugin. Without the ability to monitoring queries in this manner it could take you hours to trying to figure out why you have no echo output and still not see the extra “_” that should be removed.
HTTP requests slowing down website load times
Many plugins tend to use too many external resources by making numerous requests to external APIs. This can definitely slow down your site and plugins that do this should be avoided if possible.
Google Analytics or comment plugins like Disqus, Jetpack, or Facebook Comments are plugins that do just this.
An external script pulls requests from other websites. This is not necessary bad (any WordPress website is likely to use some external resources). But when you use a plugin or script that requests multiple external resources it’s important to make sure that you actually need it and you applied the best possible workaround to minimise external calls.
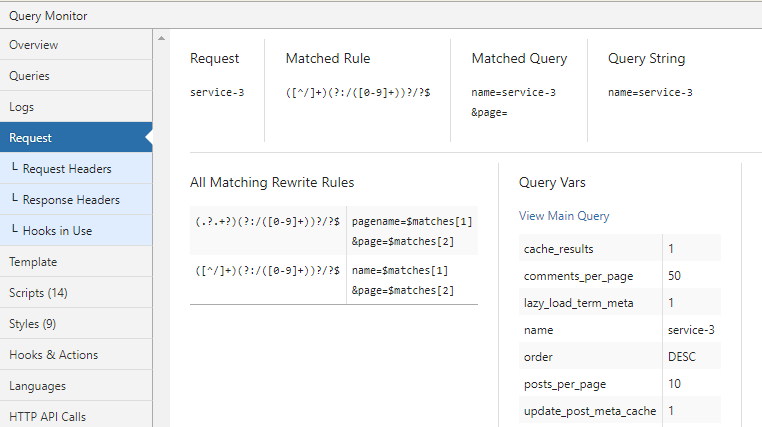
You can see the difference yourself by uploading a jQuery script on an external server. Take a look at the request times using the Query Monitor ‘Request’ and ‘HTTP API calls’ tabs. Then load the jQuery script onto your own server and have your website call it from this new internal location. You might be surprised when you compare the difference between external and internal request times .
Use these tools to checkout any plugins you’re using to see if they’re slowing down your website.
Theme Templates
The Monitor plugin can also come in handy for theme developers as they can view the template hierarchy and the PHP files that were used to build your websites pages.
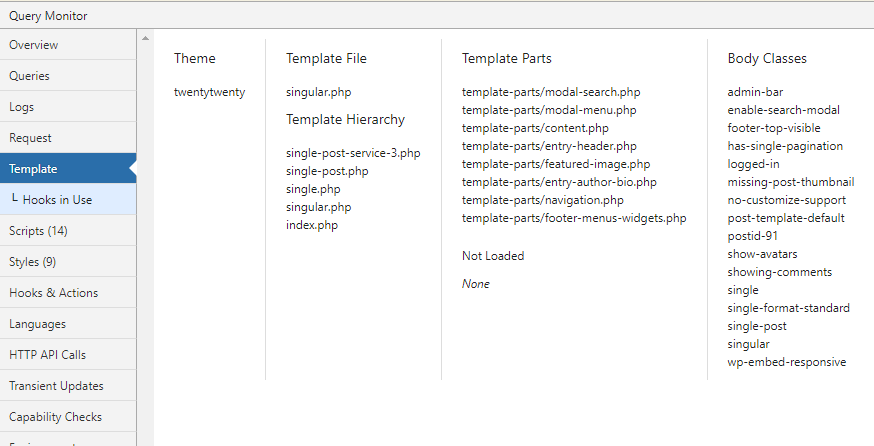
Cool, right? All the info at your finger tips. The active theme name, body classes for the current request, all template parts that were loaded (or not loaded) for the current page and the template filename and hierarchy.
Conclusion
Possessing the right tools can make a developer’s job so much easier and the Query Monitor plugin is definitely one to add to the toolkit! Make the most of the plugin to monitor the resources being used like memory or cached content or track down a plugin that is causing performance issues for your website.
If you want more information on using Query Monitor take a look at their GitHub page which provides a full list of features. Happy debugging!
Start Your 14 Day Free Trial
Try our award winning WordPress Hosting!