WordPress performance is influenced by many factors, with the PHP version being significant. This article benchmarks all PHP versions on our platform, demonstrating performance differences. The test results will help you understand each PHP version’s impact on your WordPress site’s performance and provide useful insights.
Pressidium® supports every PHP version from PHP 7.4 to the most recent release, PHP 8.2, as of the writing of this article.
However, many websites continue to run on outdated PHP versions, even though they are no longer actively supported. This is primarily due to compatibility concerns; these websites often use plugins, themes, or custom code that may not be compatible with newer PHP versions. As a result, updating PHP could potentially disrupt website functionality.
Therefore, to ensure seamless and secure operation across a diverse range of websites, we offer multiple PHP versions that our customers can effortlessly switch between with a single click. While we acknowledge the concerns this may raise, it’s crucial to emphasize the significant benefits of updating your PHP version.
In a moment, we will demonstrate these benefits with numbers and graphs as well.
How We Performed the PHP Benchmarking
On all the tests we performed, we used the following environmental setup:
- Vanilla installation running WordPress version 6.5.5
- Theme: Twenty Twenty-Four
- Plugins: none
The hardware we used has the following specifications:
- Backend Server Specs: 6 CPU, 16GB RAM
- DB version: MySQL 5.7
- Server-side caching: disabled
- PHP OPcache: enabled
Our Testing Methodology
We conducted our tests using the specified setup across all available PHP versions on our platform: v7.4, v8.0, v8.1, v8.2.
During the numerous phases of our testing, we made requests to the following pages as part of our test plan:
- Homepage (GET /)
- Register Page (GET /wp-login.php?action=register)
- Register (POST /wp-login.php?action=register)
- Login Page (GET /wp-login.php)
- Login (POST /wp-login.php)
- Sample Page (GET /sample-page/)
- Logout (GET /wp-login.php?action=logout&_wpnonce=**********)
NOTE: To keep our testing on the scope of PHP benchmarking, we’ve disabled our server-side caching solution. This choice ensures every request hits the backend directly, aligning with our focus on accurate performance testing and benchmarking for PHP.
Also, all tests skipped downloading dynamic or embedded content such as media, styles, and scripts from both local and external sources. This is because PHP isn’t involved in serving these files. Excluding these requests helps keep our benchmarks cleaner and more relevant to our goals.
The testing client was initialized on the same Pressidium server cluster hosting the test site to minimize or eliminate network latency fluctuations that could skew the results.
The testing involved a total of 50 concurrent threads, or virtual users, iterating over the above test plan in a loop, achieving our target of approximately 50 requests per second during peak, as indicated by our results. All requests were made with a random delay of 0.75 to 1.0 seconds between each.
Here is the Concurrent Users VS Mean Response Times graph.

Following the purple line, you can see that the testing spanned 5 minutes: it began with a 2-minute ramp-up period where 5 threads were added every 2.4 seconds, followed by a 2-minute phase maintaining a maximum of 50 concurrent threads. Finally, a 1-minute ramp-down period ensued, reducing one thread every 1.2 seconds.
NOTE: The Mean Response Time over time is calculated by summing up the response times of all samplers within a specific time period and then dividing this sum by the total number of samplers executed during that time period. In our results, this metric is aggregated at 1-second intervals in all our graphs; providing an averaged metric that reflects the typical response time experienced across the entire testing duration.

Now, let’s proceed with analyzing the results.
The Results and Verdict of Our WordPress PHP Testing
While we collected numerous metrics and generated various graphs and tables, this overview highlights the most common metrics. We also include a combined graph displaying processing latency over time (left axis) and requests per second over time (right axis) for each PHP version tested.
NOTE: We primarily considered the Processing Latency Over Time metric as useful information for this article.
This measurement records the time from when the browser connects to the server until the first response is received. It’s similar to network latency or time to first byte (TTFB) minus the connection time (DNS lookup + TCP + SSL/TLS connection establishment).
That means, using processing time is a little more precise than using latency or response time for the PHP benchmarking scope of this article.
PHP 7.4
Test Summary:

Processing Latency Over Time:
PHP 8.0
Test Summary:

Processing Latency Over Time:
PHP 8.1
Test Summary:

Processing Latency Over Time:
PHP 8.2
Test Summary:

Processing Times Over Time:
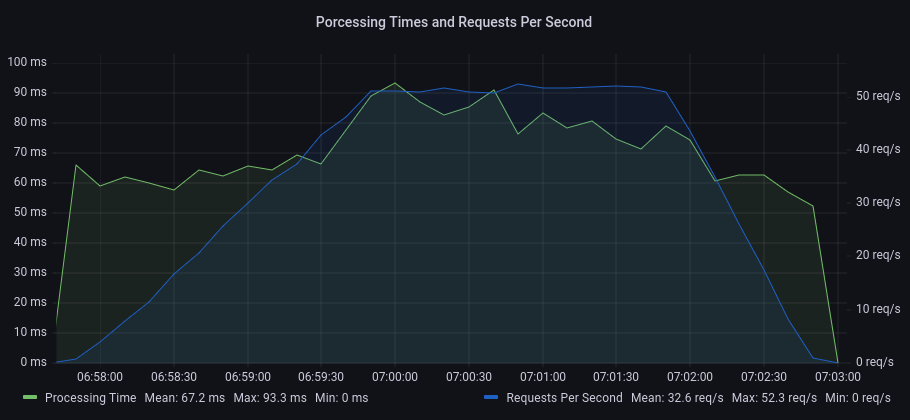
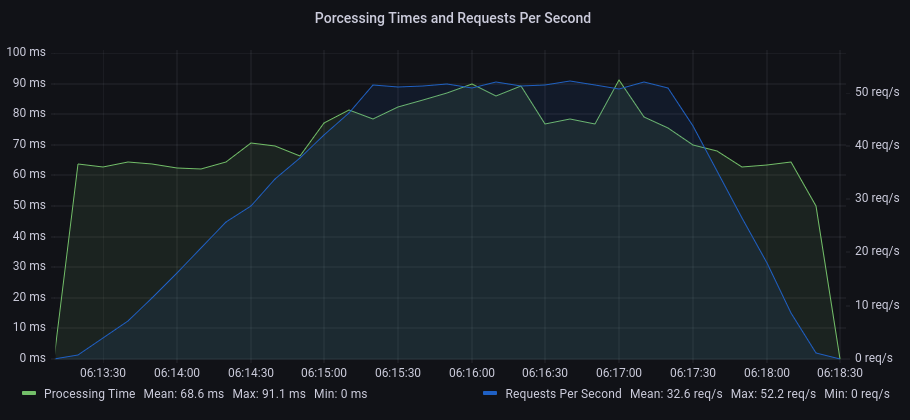
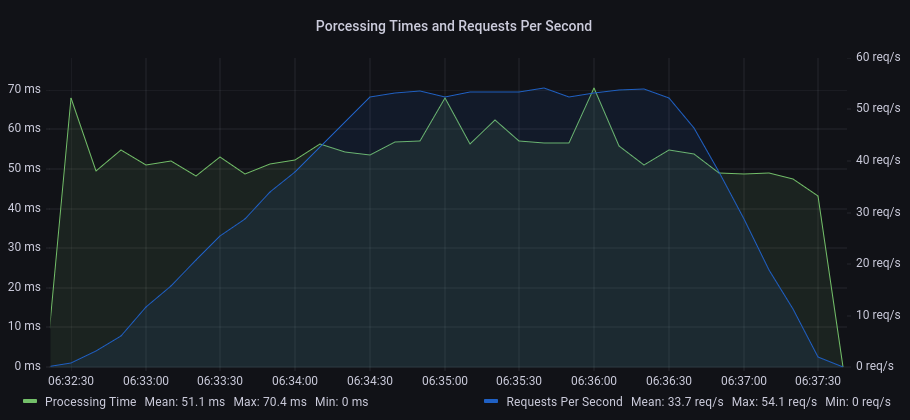
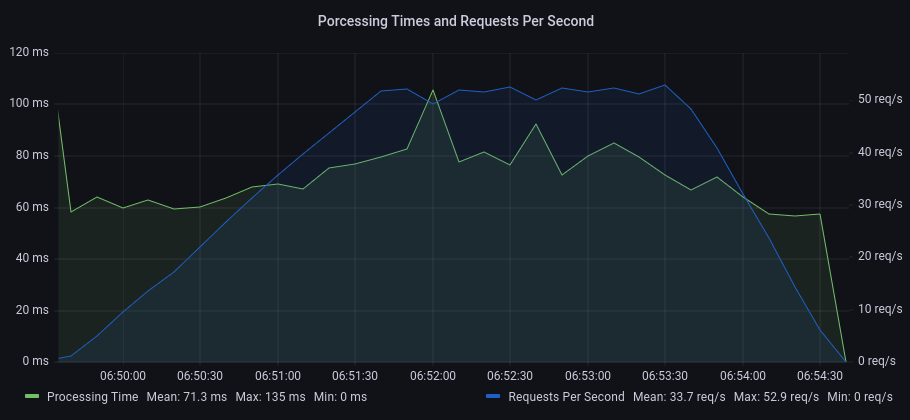
The mean processing time decreased from version 7.4 to 8.0, but we noticed slower timings in subsequent versions.
| Processing Times Over Time | Mean | Max | Min |
| PHP v7.4 | 68.6 ms | 91.1 ms | < 0.1 ms |
| PHP v8.0 | 51.1 ms | 70.4 ms | < 0.1 ms |
| PHP v8.1 | 71.3 ms | 135 ms | < 0.1 ms |
| PHP v8.2 | 67.2 ms | 93.3 ms | < 0.1 ms |
The site’s performance metrics follow the same trend:
| Mean Response Time | Total Requests | |
| PHP v7.4 | 91.7 ms | 9170 |
| PHP v8.0 | 67.1 ms | 9464 |
| PHP v8.1 | 94.7 ms | 9182 |
| PHP v8.2 | 90.4 ms | 9192 |
We can see a significant improvement between v7.4 and v8.0 for all the other metrics too.
Takeaways
Upgrading from PHP 7.x to PHP 8.0 will most likely result in a significant performance benefit for most sites.
Interestingly, PHP 8.1 and PHP 8.2 did not continue the performance improvement trend of PHP 8.0.
PHP 8.1 exhibited the highest mean processing time of 71.3 ms.
PHP 8.2 showed slight improvement but still lagged behind PHP 8.0. This variability suggests testing site-specific compatibility and performance before updating to newer PHP versions is crucial.
Keep in mind though that performance may vary on different or lower-end hardware configurations. Moreover, the testing was conducted on a vanilla WordPress installation using the Twenty Twenty-Four theme without plugins. This setup may not fully represent the diverse configurations of real-world WordPress sites.
We shared this to highlight WordPress performance variations by PHP version. We hope you found it useful. The general best practice is to always update your WordPress site’s PHP to the latest compatible version.
Maintaining themes, plugins, and the WordPress backend to be compatible with the latest PHP versions results in faster processing times. This leads to quicker page loads and an enhanced user experience. Optimizing PHP performance is not just a technical necessity but a strategic business decision.
This article is part of our comprehensive performance series, focusing on how PHP versions influence WordPress speed and efficiency.
Read Also
- WordPress PHP Support and Compatibility Across All Versions
- What is Performance Testing?
- How To Reduce Initial Server Response Time (TTFB) in WordPress
For a comprehensive approach to optimizing WordPress performance, including insights on PHP versions, server tuning, and testing methodologies, read our full WordPress Performance Optimization Guide online. No downloads or email required. Just free, in-depth content.
💡 Free Performance PDFs: Ready to boost your site beyond PHP upgrades? Download our
- Server-Side Optimization Checklist
- Client-Side Optimization Quick Wins
- How to Choose the Right Hosting Provider.
These concise references cover backend tuning, front-end speed improvements, and hosting evaluation, helping you achieve consistent, end-to-end WordPress performance.
Now that you’ve seen how PHP versions can impact performance, why not experience the speed difference firsthand?
Run your site on a high-performance stack optimized for modern PHP with zero commitment.
Beyond PHP: Performance at the Edge
Upgrading PHP gives you a clear speed boost. But true WordPress performance isn’t just about the runtime. Your site also needs to deliver content instantly, stay secure, and remain reliable for visitors across the globe.
That’s why we built Pressidium EDGE. Our global network that pushes performance to the next level:
- Blazing-fast load times. Static and dynamic content is intelligently cached closer to your visitors.
- Proactive edge security. Threats and attacks blocked before they reach your site.
- Consistent uptime worldwide. Intelligent load balancing keeps your site available everywhere.
With Edge built into every Pressidium plan, you get enterprise-grade performance and protection automatically.
Click below to experience it for yourself.
Start Your 14 Day Free Trial
Try our award winning WordPress Hosting!


