Beautiful website design? Yes. Written perfect copy that will appeal to your customers? Definitely! So, job done. The website is perfect and there is nothing else to do, right? Well not quite!
If you want to maximize the value delivered by your website then it’s vital to keep track of how your website is performing. How many visits is it getting? Where is this traffic coming from? Is there a certain time of day when things get busy?
In addition, how is your site operating from a technical standpoint? Are your visitors getting a bunch of 404 (not found) errors? Or are you getting server errors you’re not aware of?
The perfect website is only perfect when it’s working as intended. And, in order to ascertain whether or not this is the case you need access to detailed analytics that can answer all these questions and more.
The Problem with Analytics
Traditionally, gathering website analytics can be a tricky job. It normally involves one or more third-party apps (such as Google Analytics) which rely on JavaScript, cookies and tracking pixels to do their thing. This might add unnecessary load to your page and possibly provide inaccurate data (if the end-user is blocking things like cookies or using ad-blockers).
In addition, these types of Analytic apps are tailored to gathering user-specific data, usually for ad targeting or analyzing user actions, and may not include vital server-related performance data or track things like 404 errors. All-in-all, it can be a real headache to get the data you need to make sure your website is performing optimally.
Say Hello to Website Analytics from Pressidium
Fortunately, if you host with Pressidium, you have access to just about all the data on your website you could possibly want courtesy of our Dashboard Website Analytics suite. And the best bit? It’s included at no extra charge for all our customers.
Server-Side Data… no setup or scripts required
One of the downsides of using third-party Analytic tools is the method they use to track website usage (such as cookies and placing JavaScript client scripts). Cookies and JavaScript analytics trackers can be blocked and as a result, your data can become inaccurate. All bad news. Pressidium Analytics takes things to the next level by collecting data server-side, directly from the edge nodes. No code is required to run on the client. This not only means it’s more accurate but it won’t impact your website from a performance perspective at all. Server-side data analytics can complement and enrich any client-side analytics solution, helping you paint a more accurate picture of your site’s traffic.
Try our Award-Winning WordPress Hosting today!

404? What 404?
It can be extremely hard to collect data on 404 errors and most third-party analytic apps won’t be able to help. It’s absolutely critical however that you can quickly and easily see if your site visitors are requesting information on your site that isn’t available. Nothing ruins a visitor’s experience more than clicking on a link and being taken to a 404 error page. Those days are gone thanks to Pressidium Analytics.
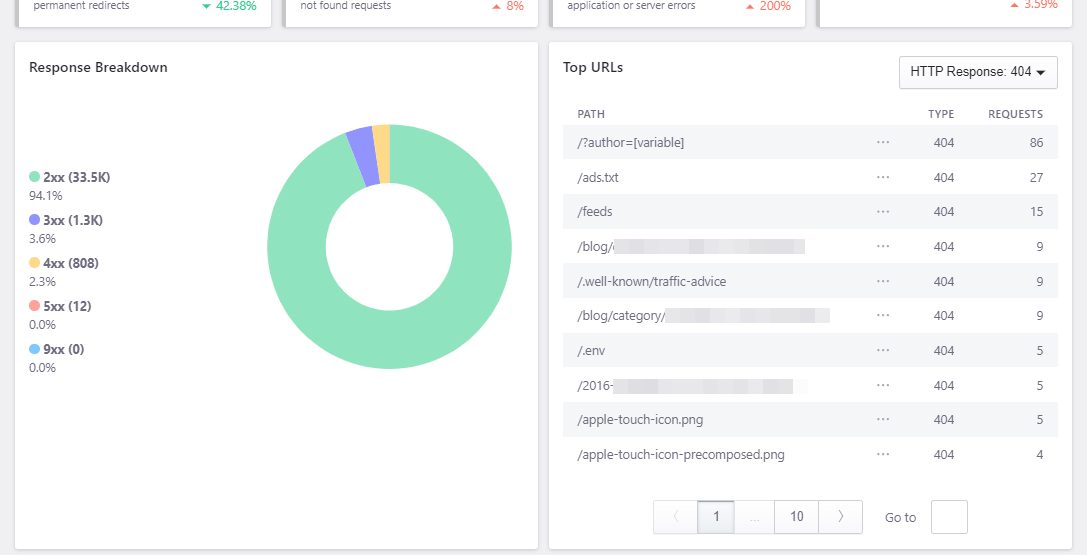
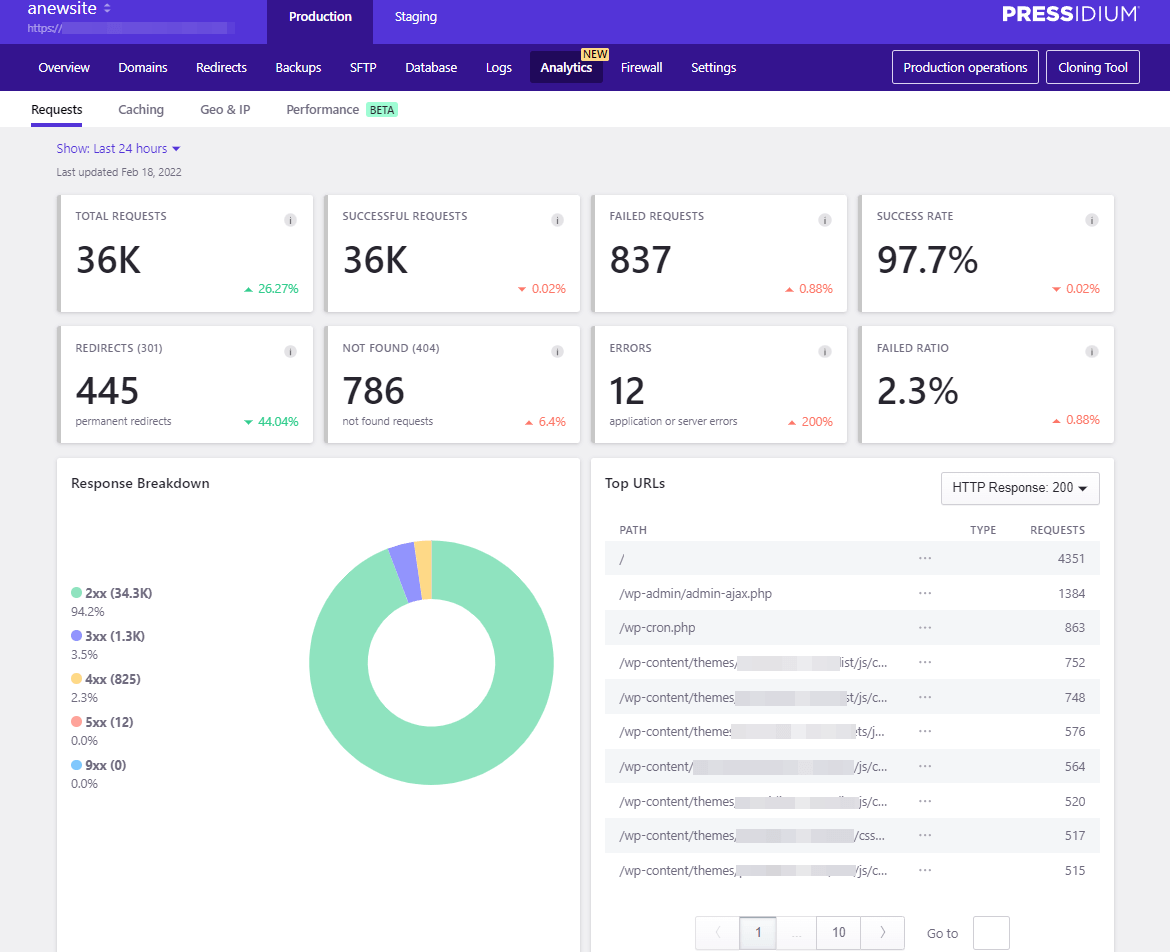
From the Analytics Dashboard, you can view the Requests made to your site during the last 24hrs, 7/14 or 30 days. The data generated shows the total number of requests, failed requests and a whole lot more. Included with this data is the ability to view 404 responses along with a host of other responses (such as 503 server errors). In addition, you can see the ‘Total Number of Requests per hour’ in graph format allowing you to identify the peak traffic times to your site.
To Cache or Not to Cache
Caching WordPress websites is absolutely vital in order to maximize the end-user experience by speeding up website load times. Pressidium takes care of this with our Multilayer Adaptive Caching engine which means this is one less thing for you to worry about (and no plugin needed for this either!).
It can be useful to see how the Caching engine is performing with your website and whether there is content that is excluded from caching, bypassing the cache engine. To that end, our Analytics suite includes detailed Cache related data that allows you to deep-dive the cached status of your website.
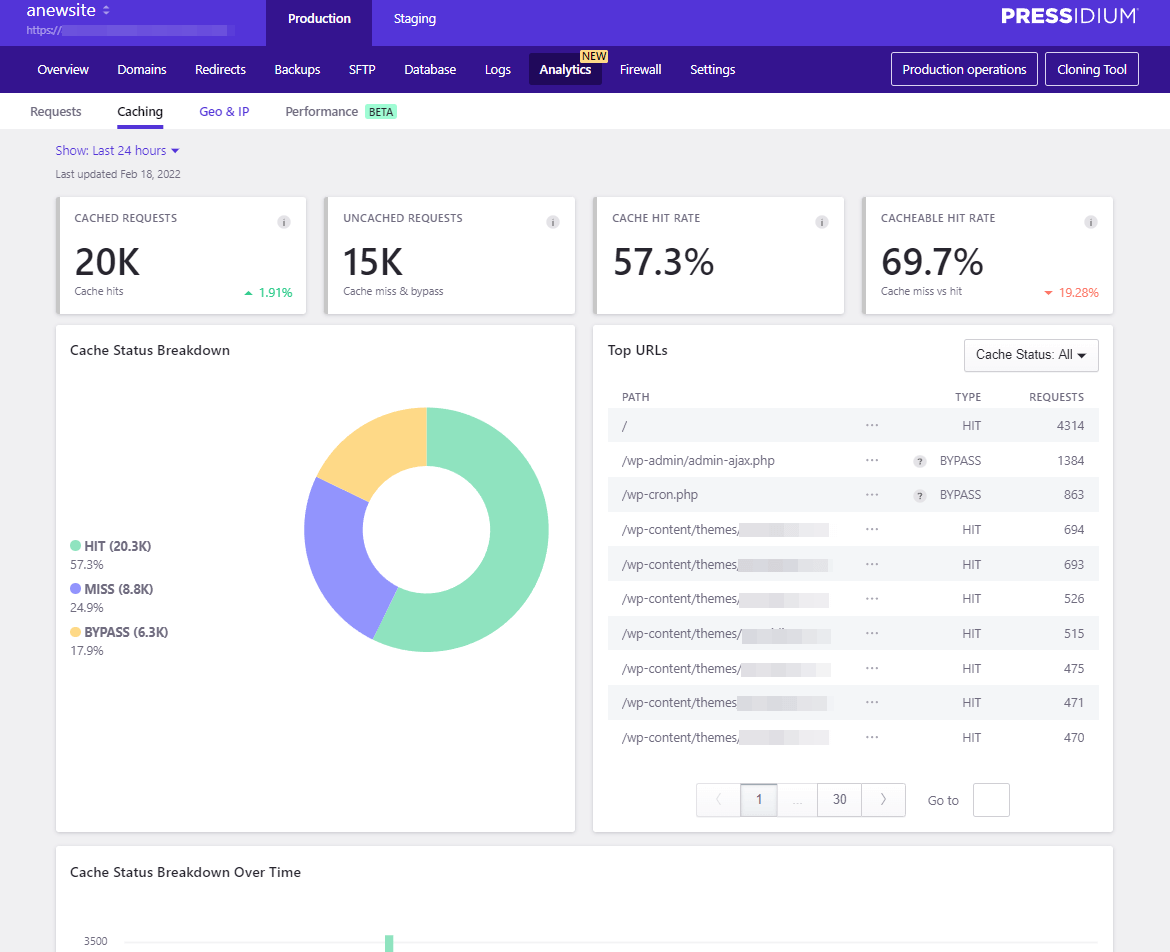
Data includes HIT / MISS / BYPASS details with further information on the status of a request available by hovering over the tooltip next to the URL request listed in the Caching panel. For full details on how to understand and use the data provided in the Caching Analytics tab see our detailed KB article here.
Where did that traffic come from?
It can be incredibly useful to see where traffic to your website is originating from. With our Geo & IP Analytics you can quickly get a detailed overview of the countries where your users are accessing your site from.
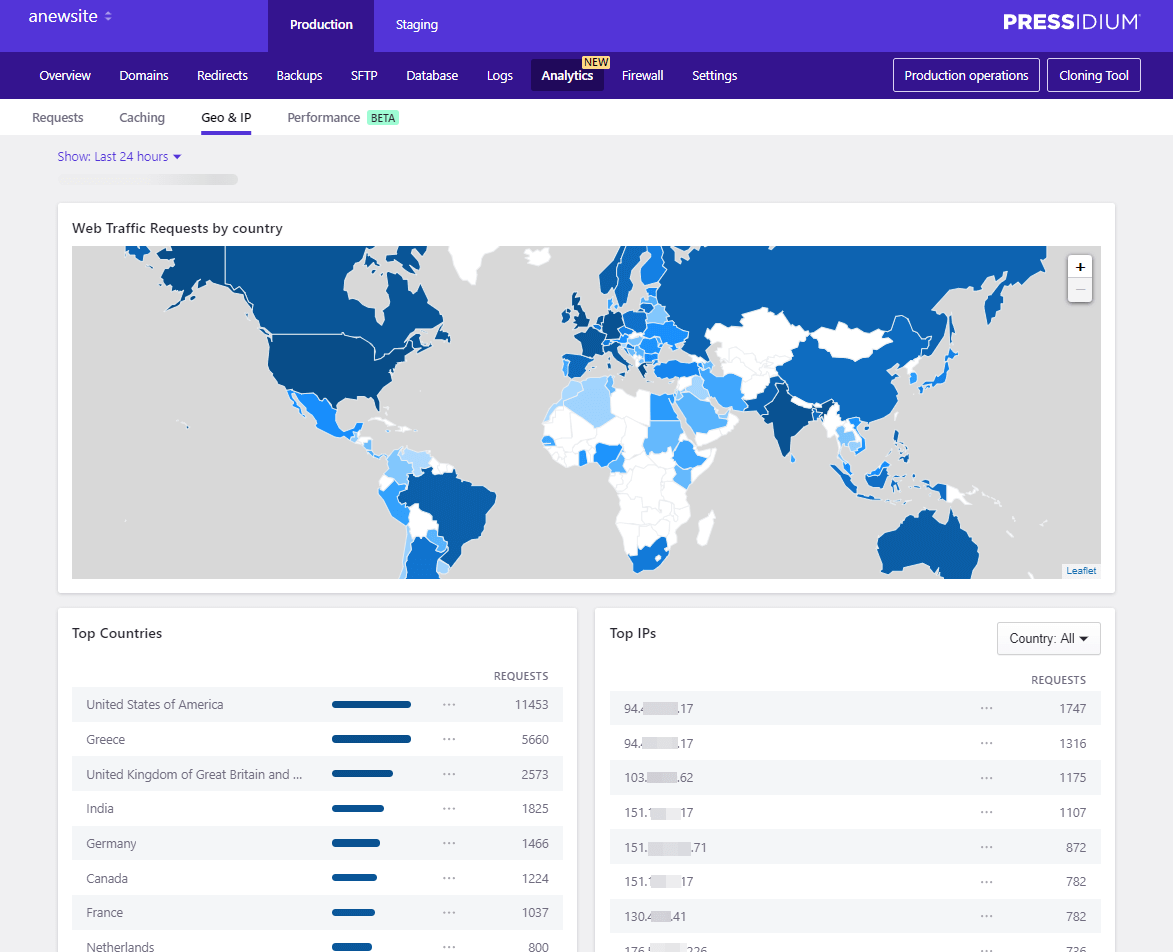
In addition, you can view the Top IP addresses and the number of requests made.
NEW: Performance Analytics
The latest addition to our Analytics Suite is Performance Analytics. You can now review your website’s key performance indicators, such as average response time and requests per minute, across a date range.
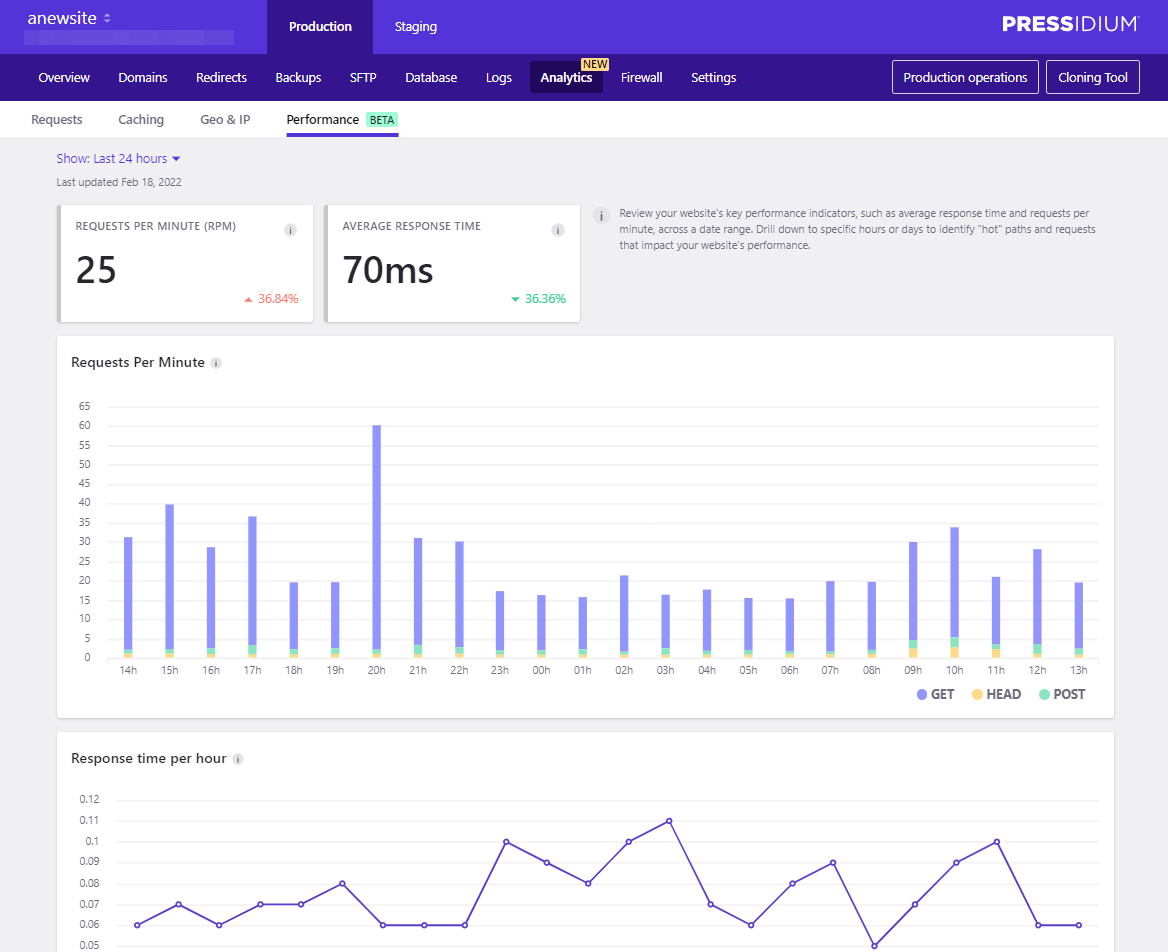
In addition, you can also drill down to specific hours or days to identify “hot” paths and requests that impact your website’s performance. This is an incredibly useful feature and can save hours and hours when trying to debug a site. It can also highlight problems you didn’t even know about that could be impacting the real-world performance of your site.
NEW: Data Export
The Analytics Suite has been carefully designed to present available data in an informative manner. Under most circumstances, you should be able to get the insights required via this interface. Where further analysis is required however you can now export your data from the Analytics Suite into a plain CSV file, allowing you to manipulate this information as needed.
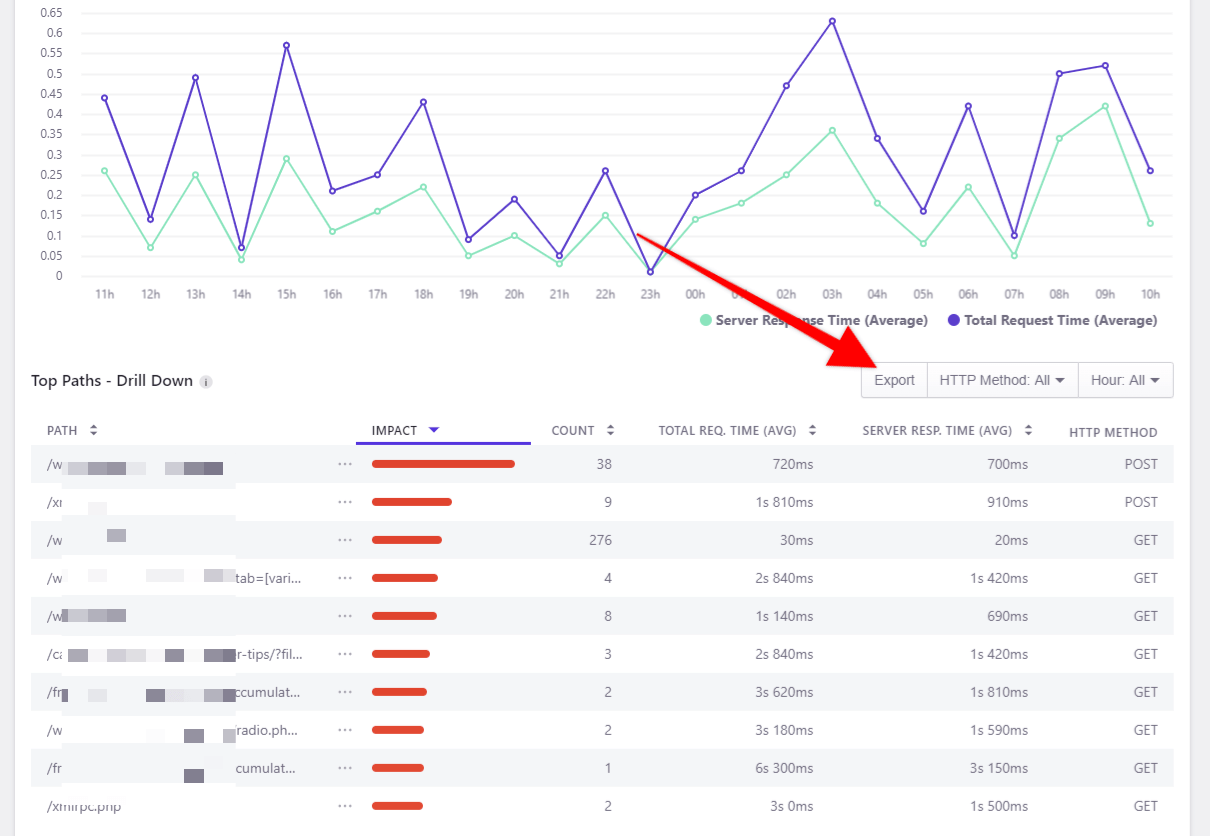
To do this, click on the Export button which will trigger a browser file download with the requested data exported as a plain text CSV (comma separated) file. The generated CSV files include a data header in the first line / row. For each data table the exported data reflect the “current” filtered view. i.e. the export includes only the data visible in the applied filtered view and not the entire dataset. This way you can export one or more data views (or the entire unfiltered data set) as separate files.
Getting Started with Website Analytics
Using the suite of Analytics available to Pressidium customers is as easy as logging into your Dashboard, selecting a website and then clicking on the Analytics tab. Analytics are enabled by default for all websites hosted with Pressidium and you’ll see data begin to accumulate within 24hrs of launching a new site. As mentioned, data is pulled server-side. No additional setup is required. For further details on how to use Analytics check out our KB article here.
We hope you find Analytics a useful tool!
Start Your 14 Day Free Trial
Try our award winning WordPress Hosting!


